The accuracy of flow cytometry experimental results largely depends on the experimental staining panel design. An excellent panel design can maximize signal resolution while minimizing fluorescent interference. This article focuses on the core aspects of flow cytometry panel design: selection of target markers, flow cytometer configuration, rational matching of target markers using fluorochrome information, and provides step-by-step guidance to design multicolor flow cytometry panels with clear signals, clean backgrounds, and reliable data through practical examples.
I. Clarify Objectives: How to Select Markers Based on Experimental Goals
In flow cytometry, the most basic task is to determine which cell populations need to be detected and the specific markers for each cell population. Therefore, we need to clarify the following four questions:
 What are the cell populations to be detected? (e.g., T cells, B cells, NK cells)
 What are the markers of the target populations? (e.g., CD45 for gating lymphocytes)
 What are the functional or status markers of the targets? (e.g., Treg cells require CD25 and Foxp3)
 What are the expression levels of each marker? (High, medium, low)
Table 1. Common Immune Cell Markers
| Cell |
Human |
Mouse |
| Common Leukocyte Antigen |
CD45 |
CD45 |
| Hematopoietic Stem Cells |
Lin(-),CD34,CD38(-),CD90,CD117 |
Lin(-/low),Sca-1,CD117,CD150 |
| B Cells |
CD19,CD20 |
CD19,B220(CD45R) |
| T Cells |
CD3 |
CD3 |
| Helper T Cells |
CD3,CD4 |
CD3,CD4 |
| Cytotoxic T Cells |
CD3,CD8 |
CD3,CD8 |
| Regulatory T Cells (Tregs) |
CD4,CD25,Foxp3,CD127(low/-) |
CD4,CD25,Foxp3 |
| Dendritic Cells (DCs) |
CD11c,MHC II,CD141,CD209 |
CD11c,MHC II |
| Natural Killer (NK) Cells |
CD3(-),CD16,CD56 |
CD3(-),NK1.1,CD49b(DX5) |
| Monocytes |
CD14,CD16(±) |
CD11b,CD115,Ly-6G(Gr-1) |
| Macrophages |
CD11b,CD68 |
F4/80,CD68 |
| Megakaryocytes/Platelets |
CD41,CD42a,CD42b,CD61,CD62P |
CD41,CD61,CD62P |
| Erythrocytes |
CD235a |
TER-119 |
| Neutrophils |
CD11b,CD15,CD16 |
CD11b,Ly-6G(Gr-1) |
| Eosinophils |
CD11b,CD193,Siglec-8,EMR1 |
CD11b,CD193,Siglec-F,F4/80 |
| Basophils |
FcεRIα,CD123,CD203c,CD117(-) |
CD49b,FcεRIα,CD200R3 |
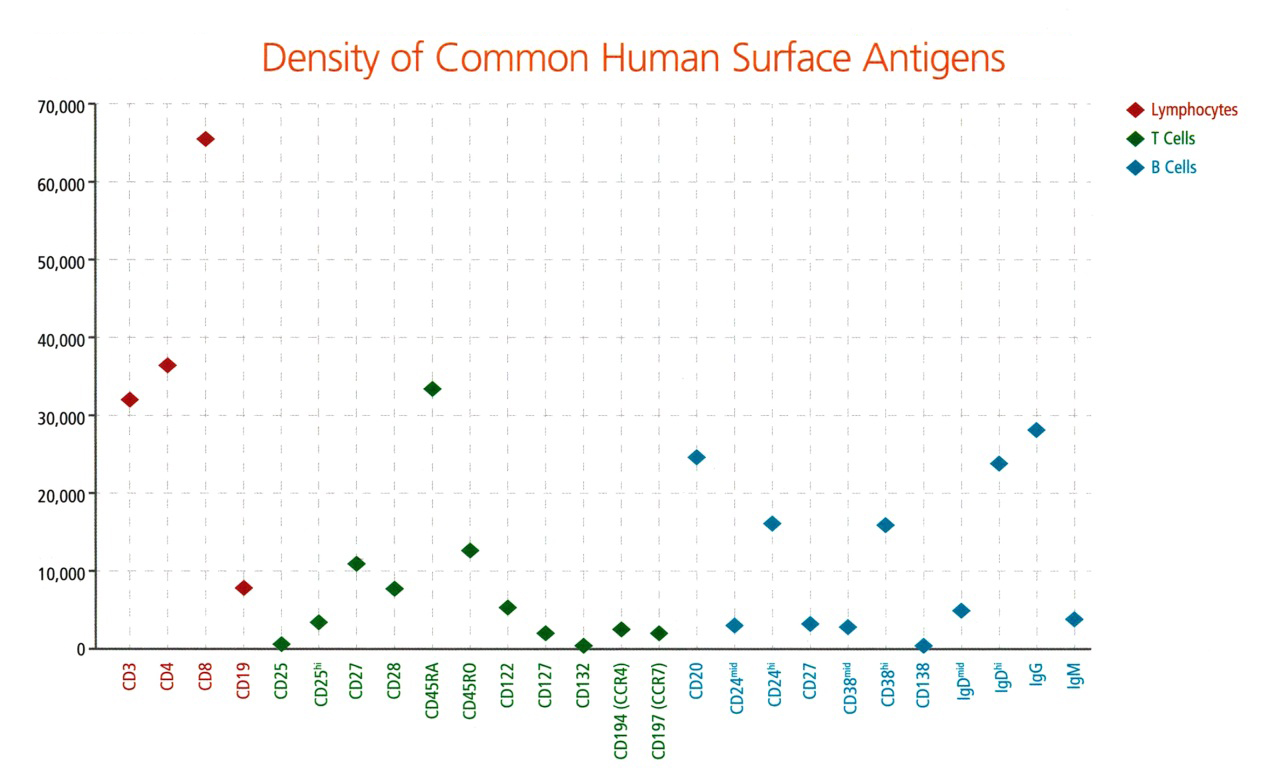
Figure 1. Density of Common Human Surface Antigens
II. Familiarize with the Instrument: Understand Flow Cytometer Laser and Filter Configurations
Before conducting multicolor flow cytometry experiments, it is essential to clarify the configuration of the flow cytometer. Filter settings vary among different brands and models; confirm the available fluorochromes based on the instrument configuration. Common lasers are shown in Table 2.
Table 2. Common Lasers in Flow Cytometry
| Laser |
Wavelength |
Commonly Used Fluorochromes |
| Ultraviolet (UV) |
355 nm |
DAPI,Hoechst,LIVE/DEAD Blue,BUV |
| Violet |
405–407 nm |
Pacific Blue,eFluor 450,Pacific Orange,eFluor 506,Super Bright,BV,CFP |
| Blue |
488 nm |
FITC,Alexa Fluor 488,Dylight 488,PE,PE tandems,PerCP,PerCP tandems,PI,7AAD,eGFP,YFP |
| Green |
532 nm |
PE,PE tandems,Alexa Fluor 532,PI,mCherry,RFP |
| Yellow |
561-568 nm |
PE,PE tandems,PI,mCherry,RFP |
| Red |
633-647 nm |
APC,Alexa Fluor 647,Alexa Fluor 700,APC tandems |
III. Understand Fluorochromes: Key Parameters and Spectral Overlap Analysis
After confirming the fluorochromes detectable by the instrument, determine which fluorochromes are compatible in a single panel based on their relevant parameters (excitation spectrum, emission spectrum, relative brightness, etc.). Fluorochromes with severe overlap between excitation and emission spectra should not be used in the same panel; prioritize fluorochromes with minimal spectral overlap.
For more information on fluorochrome selection, refer to: Understanding Spectral Graphs: The Key to Designing Multicolour Panels in Flow Cytometry
Table 3. Information on Common Fluorochromes
| Fluorochrome |
Maximum Excitation Wavelength (nm) |
Maximum Emission Wavelength (nm) |
Relative Brightness |
| FITC |
495 |
519 |
Moderate |
| PE |
480;565 |
578 |
Very Bright |
| PerCP |
490 |
675 |
Dim |
| APC |
650 |
660 |
Bright |
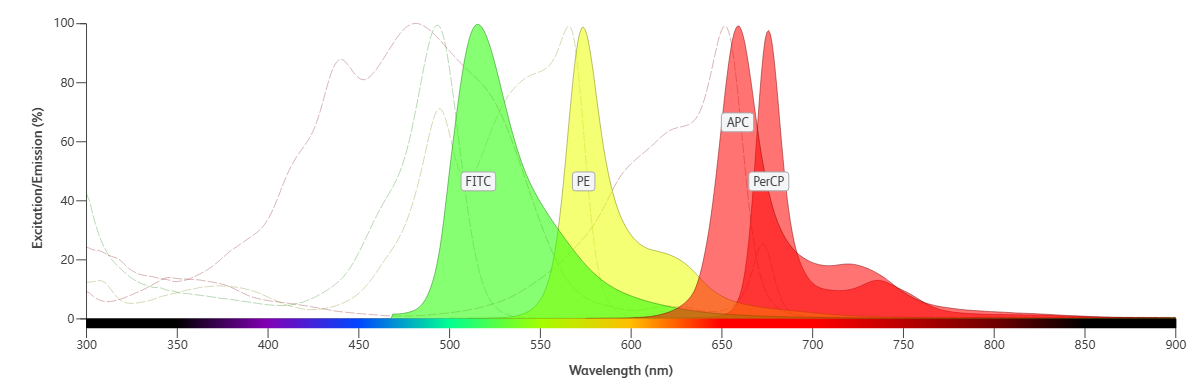
Figure 2. Spectra of Common Fluorochromes
IV. Scientific Matching: The "Strength Matching" Principle for Antigens and Fluorochromes
Once the target markers and required fluorochromes are determined, the next step is to match fluorochromes with markers. Fluorochromes vary in brightness, and markers differ in expression levels. The "Strength Matching Principle" of flow cytometry panel design is: match strong fluorochromes with low-abundance markers, and weak fluorochromes with high-abundance markers.
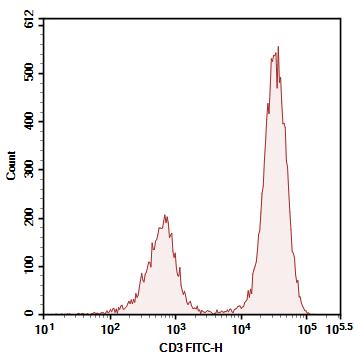
Figure 3. Comparison of Detection Results for Human CD3-FITC and Human CD3-PE
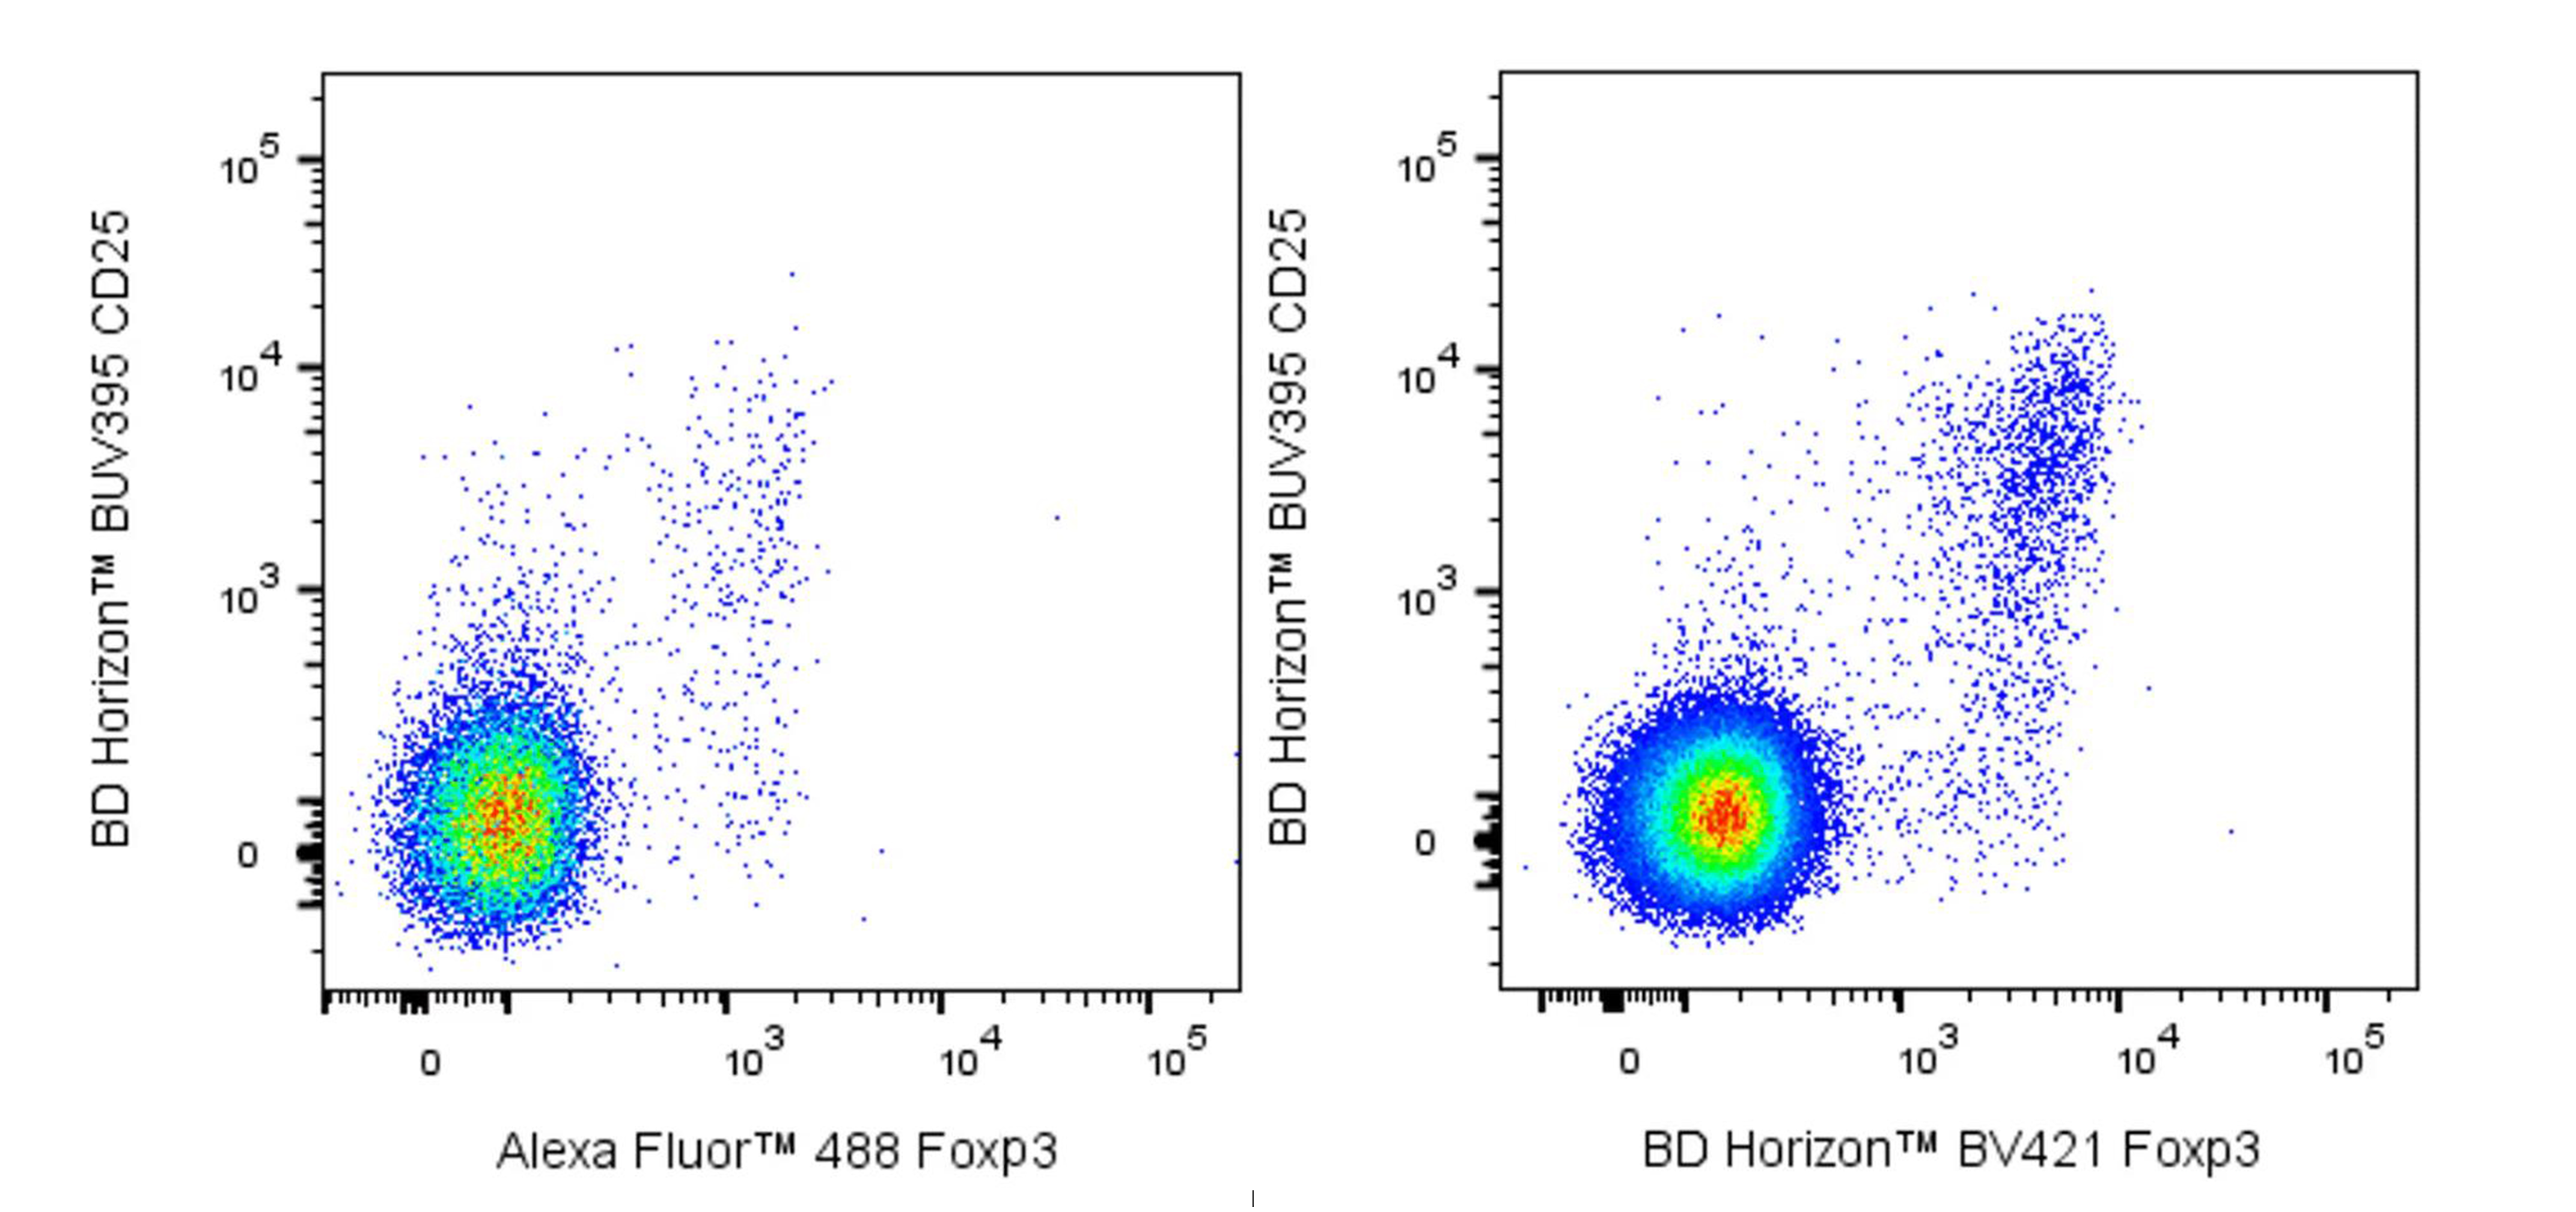
Figure 4. Comparison of Detection Results for Mouse Foxp3-Alexa Fluor™ 488 and Mouse Foxp3-BD Horizon™ BV421
As shown in Figures 3 and 4, the choice of strong or weak fluorochromes has little impact on the results for high-abundance markers. However, using low-brightness fluorochromes for low-abundance markers leads to indistinct signals of positive cell populations.
Table 4. Suggestions for Matching Markers of Different Abundances with Fluorochromes
| Marker |
Recommended Fluorochromes |
| CD3, CD4, CD8, etc. (stable and high expression) |
Relatively weak fluorochromes such as PerCP, FITC |
| CD27, CD28, CD45RA, etc. (high expression, often continuous expression) |
Moderate fluorochromes such as PerCP/Cy5.5 |
| CD25, STAT5, Foxp3, CD127, etc. (low expression, activation markers, unknown but critical) |
Strong fluorochromes such as PE, APC |
V. Practical Demonstrations
We use four common fluorochromes (FITC, PE, APC, PerCP) to demonstrate panel design for different experimental scenarios. These four fluorochromes have minimal spectral overlap and are compatible with most flow cytometers on the market.
1. Detection of T/B/NK Cells in Human Peripheral Blood
Target: T cells, B cells, NK cells (all lymphocytes).
Markers: CD45 (lymphocyte marker), CD3 (T cell marker), CD19 (B cell marker), CD56 (NK cell marker).
Expression level order: CD45 > CD3 > CD19 > CD56.
Based on the brightness information in Table 3 and the strength matching principle, the staining panel is shown in Table 5:
Table 5. Staining Panel for Detection of T/B/NK Cells in Human Peripheral Blood
Experimental Results:
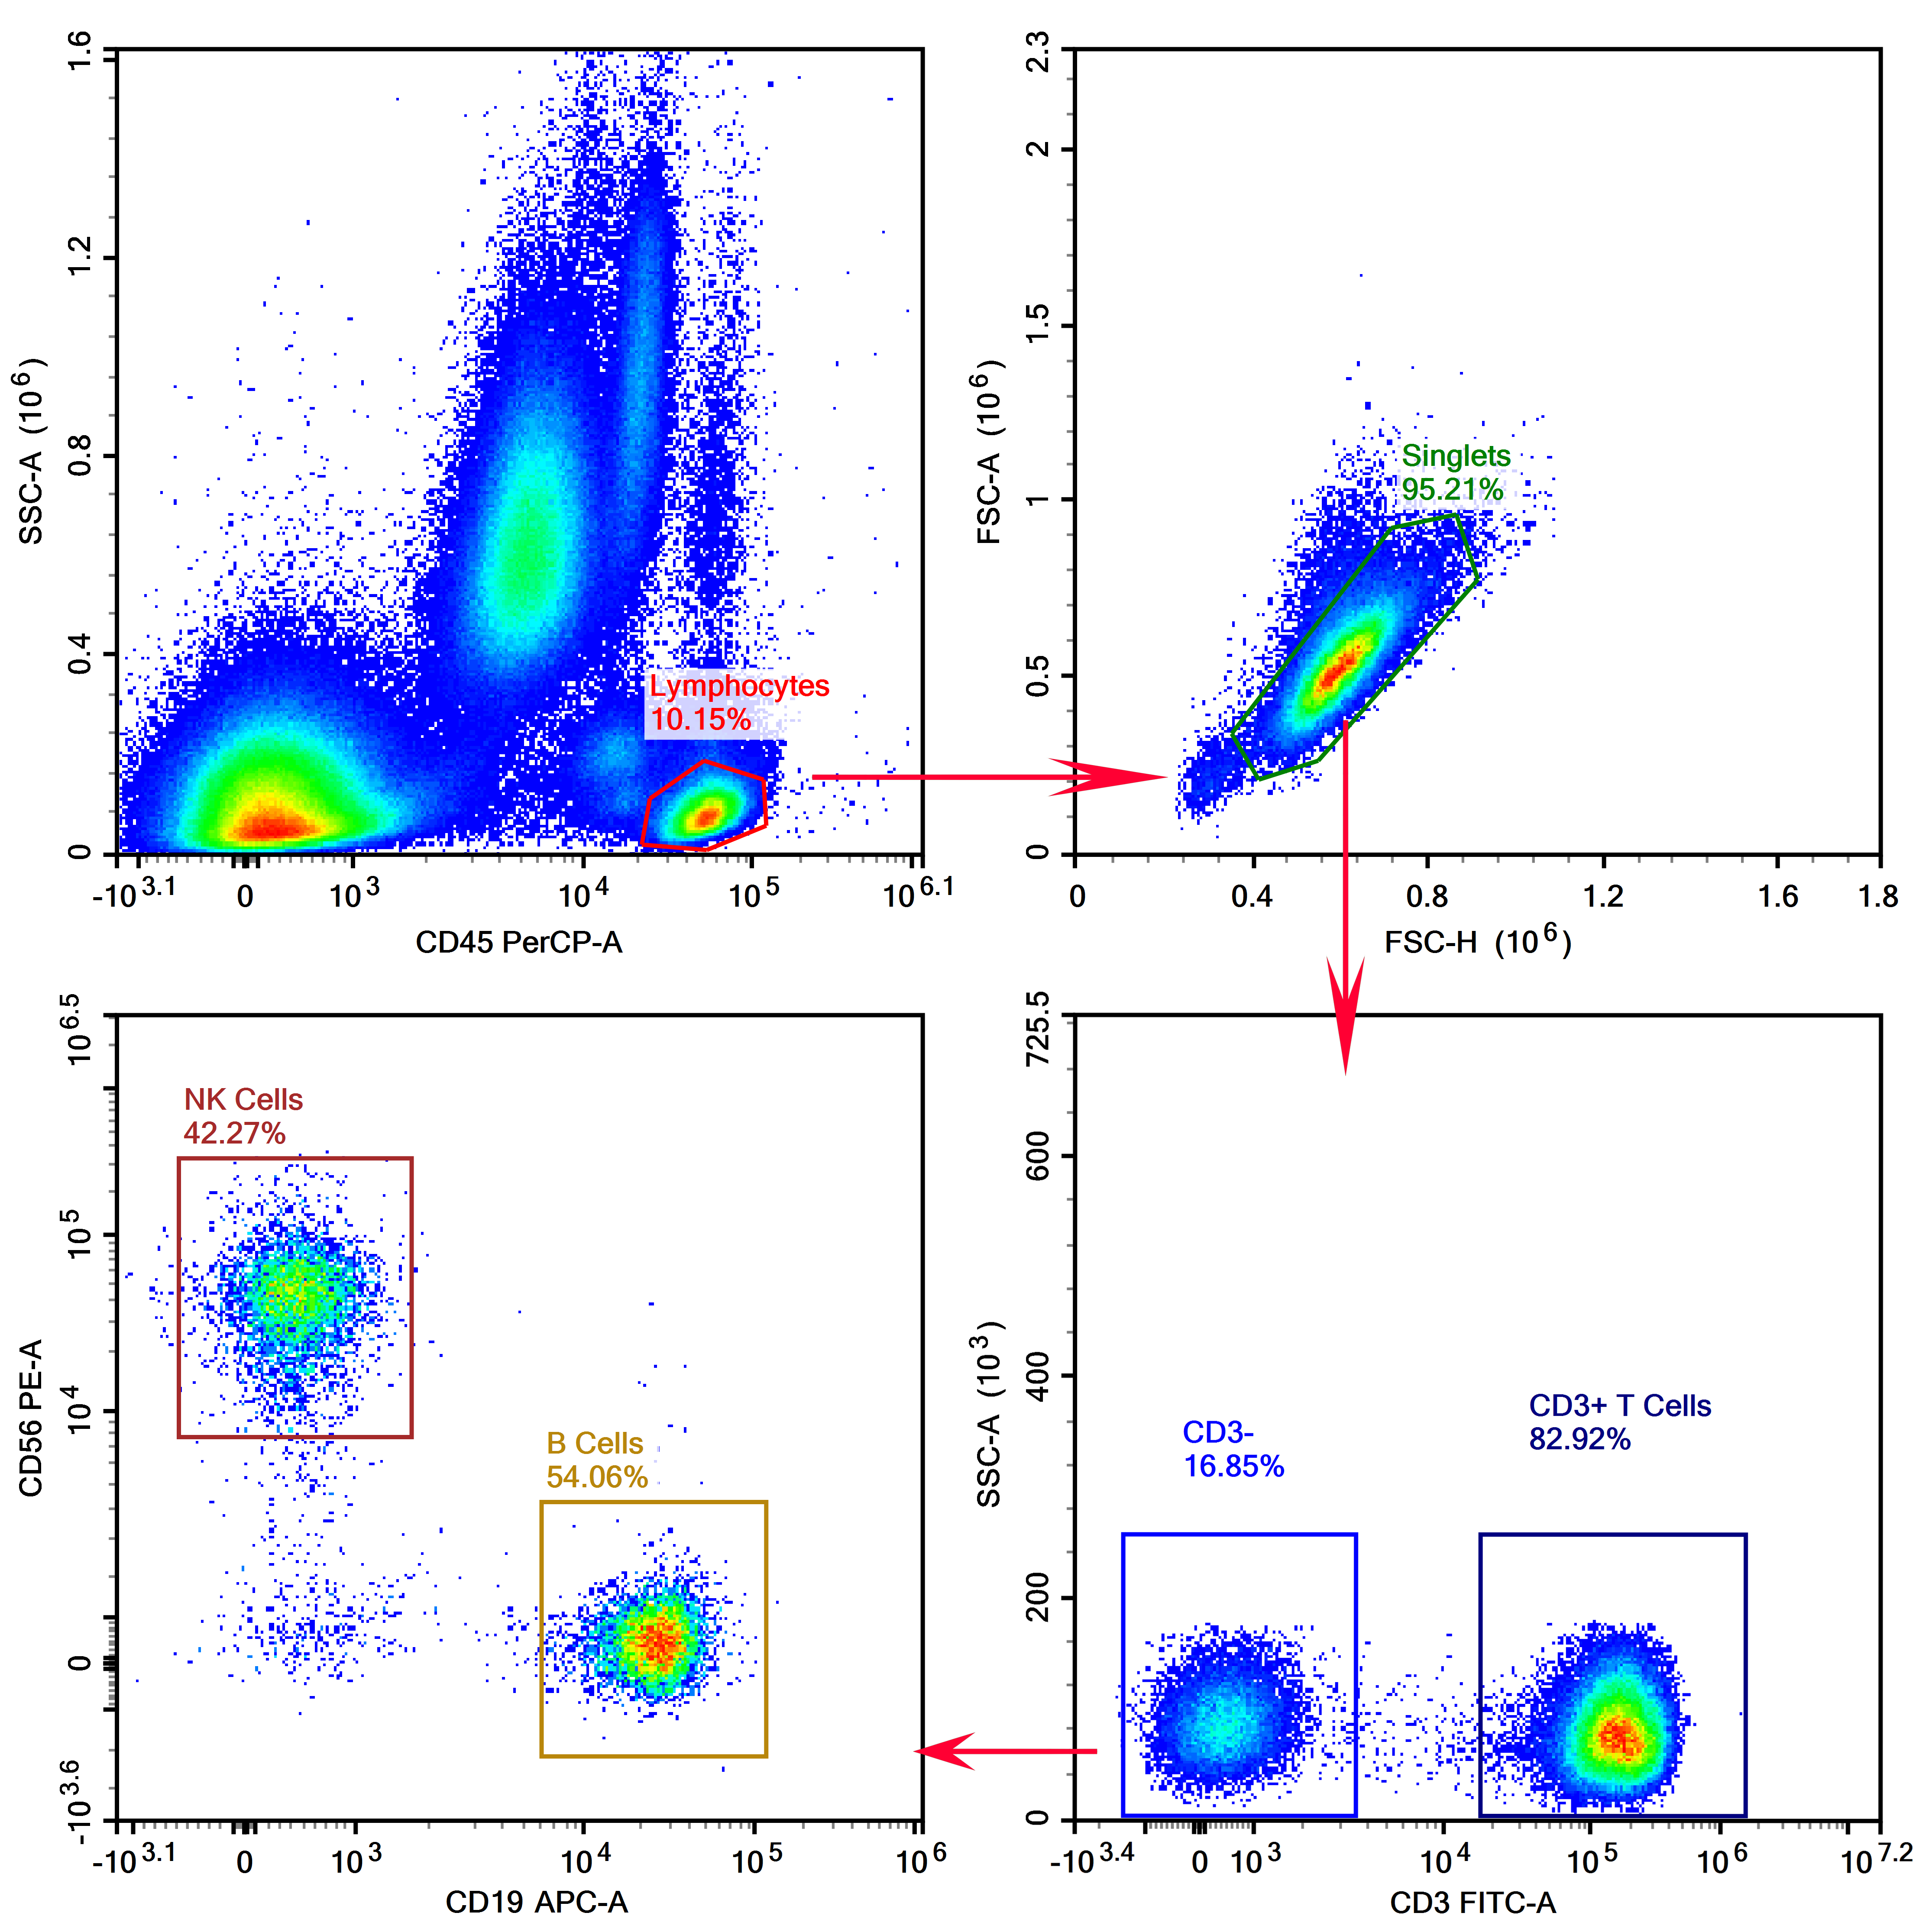
Figure 5. Results of T/B/NK Cell Detection in Human Peripheral Blood After Red Blood Cell Lysis
2. Detection of Treg Cells in Mouse Spleen
Target: Mouse spleen Treg cells.
Markers: CD4+CD25+Foxp3+ (CD25 and Foxp3 are low-expression markers; CD4 is highly expressed).
Panel Design: CD25 and Foxp3 (low-expression) are paired with strong fluorochromes (APC, PE); CD4 (high-expression) is paired with FITC (weak fluorochrome). The staining panel is shown in Table 6:
Table 6. Staining Panel for Detection of Treg Cells in Mouse Spleen
Experimental Results:
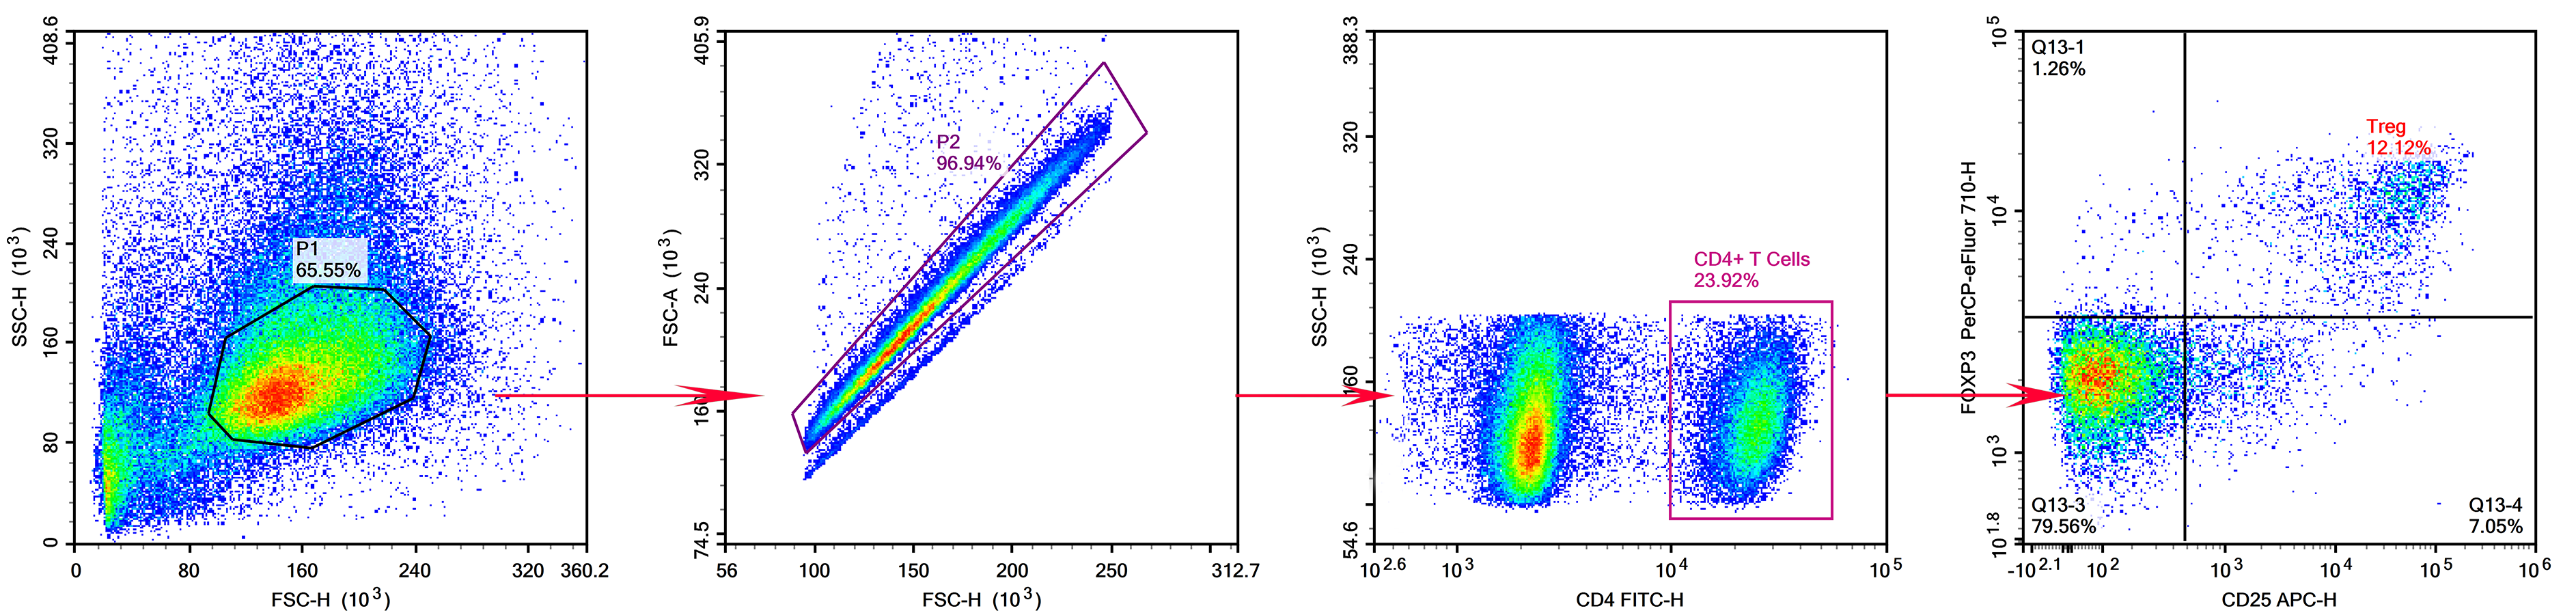
Figure 6. Results of Treg Cell Detection in Mouse Spleen
Conclusion
Rational panel design is crucial for ensuring the accuracy and reliability of flow cytometry experimental data. By fully understanding the experimental objectives, flow cytometer configurations, and fluorochrome characteristics, and scientifically matching fluorochromes with markers, experimental sensitivity and signal detection capability can be effectively improved.
About Us
abinScience was founded in 2023 as a strategic venture of AtaGenix (established 2011), dedicated to delivering premium life science reagents that accelerate discovery. Our flow cytometry antibody products cover commonly used detection markers, with a wide variety to meet the research needs of multiple species (Human, Mouse, Rat, Dog, Hamster, Monkey, etc.). We provide stable and reliable support for scientific research. For more information on abinScience flow cytometry antibodies, please click:
abinScience Flow Cytometry (FACS) Antibodies


 中文
中文 English
 한국어
한국어 日本語
日本語 Español
 Français
 Русский


