In flow cytometry experiments, factors such as experimental design, sample quality, and staining procedures all influence the final results. During data acquisition, instrument parameter settings are equally critical. Their appropriateness directly determines the accuracy of signal detection and the reliability of downstream data analysis. Even with well-prepared samples and optimized staining, improper parameter settings can lead to signal distortion, poor population resolution, and ultimately compromised experimental conclusions.
At its core, flow cytometric data acquisition is a process of signal selection and amplification: identifying true cellular events from complex backgrounds while enabling stable detection of multidimensional signals. This process relies on the coordinated optimization of key parameters, including instrument quality control (QC), threshold settings, detector voltages, stopping criteria, and flow rate. A clear understanding of each parameter and their interrelationships, along with a standardized setup strategy, is essential for generating stable, reproducible, and high-quality data.
1. Instrument Quality Control: The Foundation of All Parameter Settings
1.1 Definition of Instrument QC
Instrument quality control (QC) refers to the calibration and verification of the fluidics, optics, and electronics systems using standardized fluorescent beads after startup and before sample acquisition. QC serves as the prerequisite for all subsequent parameter settings.
1.2 Impact of QC on Experimental Outcomes
QC directly determines the sensitivity, stability, and linearity of signal detection. Only when QC passes can parameters such as thresholds and voltages function as intended. Neglecting QC may introduce unexplained intra- or inter-assay variability. For example, differences in positive population frequencies across days are often due to instrument instability rather than biological variation.
1.3 Operational Requirements
Daily QC should confirm that key performance metrics meet manufacturer specifications, including:
• Fluorescence sensitivity (e.g., CV, rCV)
• Fluorescence resolution (separation of bead populations)
• Linearity (signal proportionality across bead intensities)
• Fluidics stability (signal consistency over time)
If QC fails, perform fluidics cleaning and rerun the QC procedure. If the issue persists, verify the integrity of the calibration beads. If all factors are excluded and QC still fails, instrument maintenance or service is required. Sample acquisition should only proceed after QC is successfully passed.
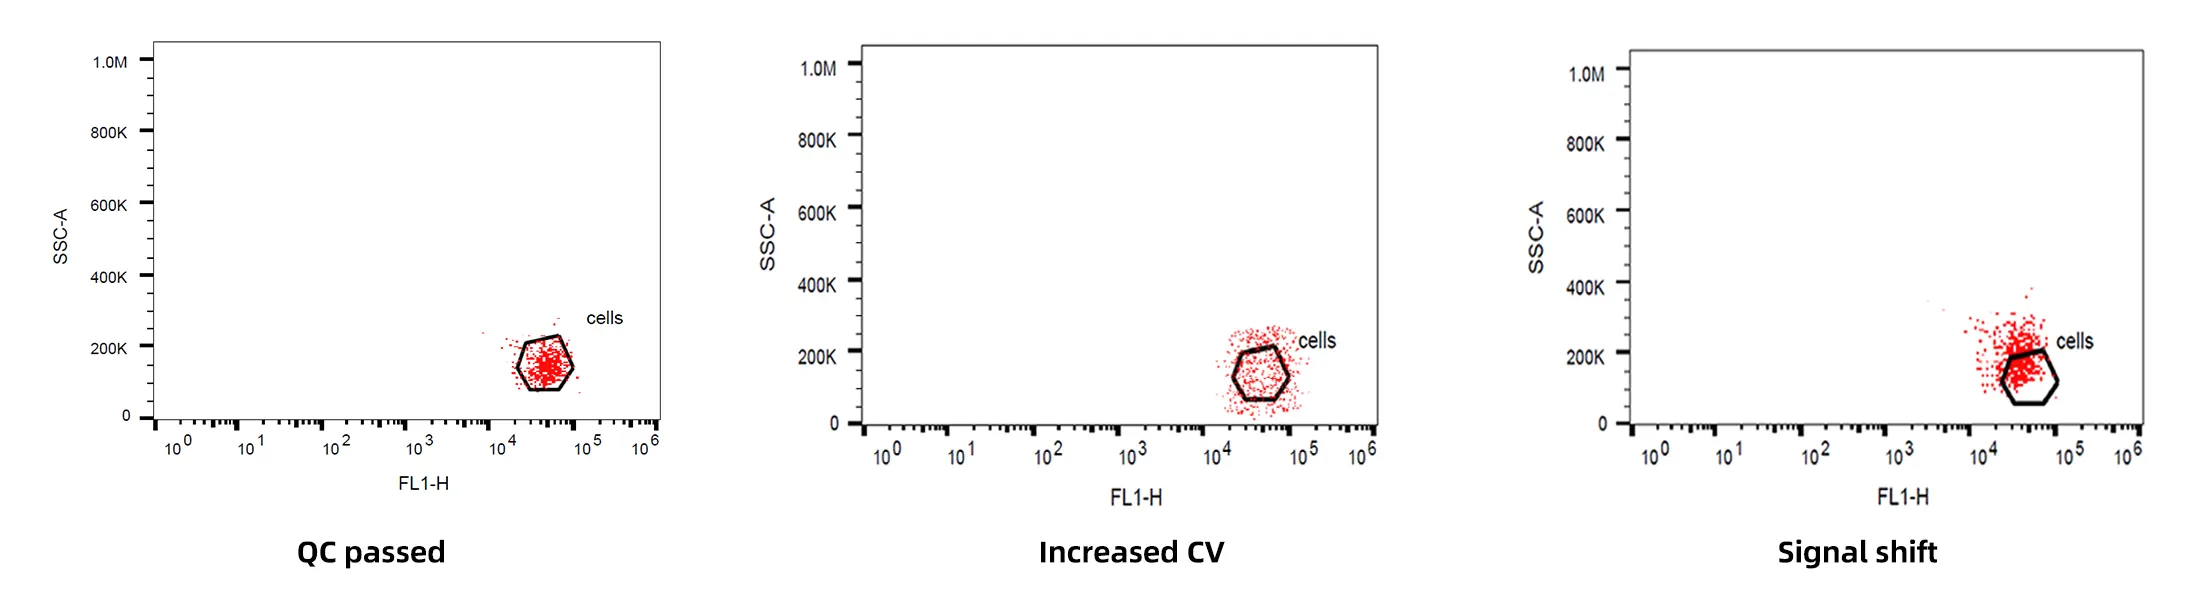
Figure 1. QC outcomes of a flow cytometer
2. Threshold Setting: The First Gate for Event Selection
2.1 Definition of Threshold
The threshold defines the minimum signal intensity required for an event to be recorded. Only signals exceeding this threshold are considered valid cellular events, while signals below it (e.g., debris, noise) are excluded from analysis.
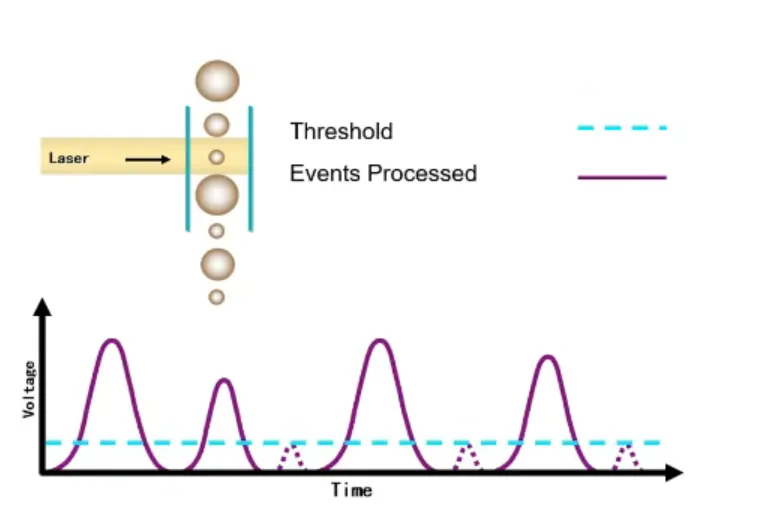
Figure 2. Signal acquisition schematic
The most commonly used trigger parameter is forward scatter (FSC), which correlates with cell size. For specific applications (e.g., platelets, microorganisms, extracellular vesicles), side scatter (SSC) or fluorescence channels may be used.
2.2 Importance of Proper Threshold Setting
Threshold selection directly affects data quality:
• Too low or absent threshold: excessive background noise and debris are recorded, obscuring target populations and complicating analysis.
• Too high threshold: small or dim populations (e.g., small lymphocytes, platelets) may be excluded, leading to data loss and distorted conclusions.
2.3 Standardized Approach for Threshold Optimization
The key principle is to maximize noise exclusion while preserving all target populations.
Recommended workflow:
• Acquire an unstained or blank sample from the same batch.
• Use FSC/SSC plots to identify noise, debris, and target populations.
• Gradually increase the threshold from a low starting point.
• Stop when baseline noise and debris are eliminated.
• Verify that target populations remain intact without truncation.
• Apply identical threshold settings across all samples within the same batch.
Acceptance criteria:
• No significant background interference
• Complete representation of target populations
• No signal clipping at lower or upper boundaries
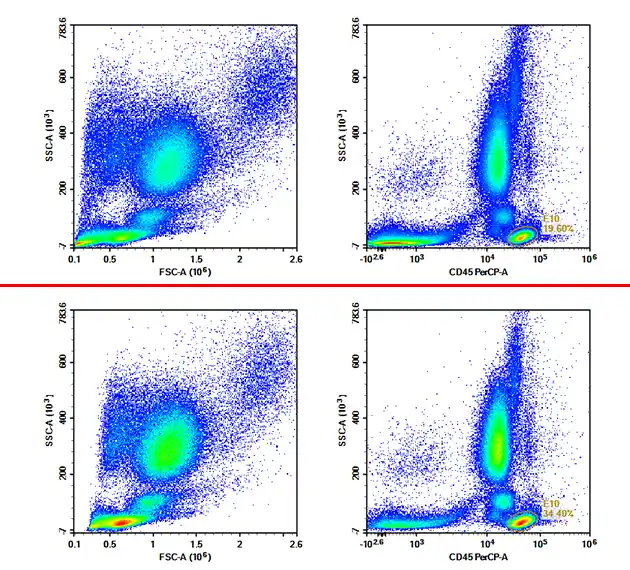
Figure 3. Comparison of threshold settings (Top: low threshold reduces lymphocyte proportion; Bottom: higher threshold increases lymphocyte proportion.)
3. Detection Channels and PMT Voltage: Core of Signal Amplification
3.1 Overview of Detection Channels
Flow cytometry channels are independent detection units corresponding to specific wavelengths, allowing separation of different signal types:
• Scatter channels: FSC (cell size) /SSC (internal complexity/granularity)
• Fluorescence channels: Each channel detects a defined emission wavelength range corresponding to specific fluorochromes (e.g., FITC ~530 nm, PE ~575 nm), enabling multiparametric analysis.
3.2 Impact of PMT Voltage
Photomultiplier tube (PMT) voltage determines signal amplification and directly affects sensitivity and resolution:
• Voltage too low: weak signals are insufficiently amplified and may be masked by noise, leading to poor separation between negative and positive populations.
• Voltage too high: signals exceed the linear detection range, causing signal saturation (“off-scale” events). Background noise is also amplified, reducing resolution.
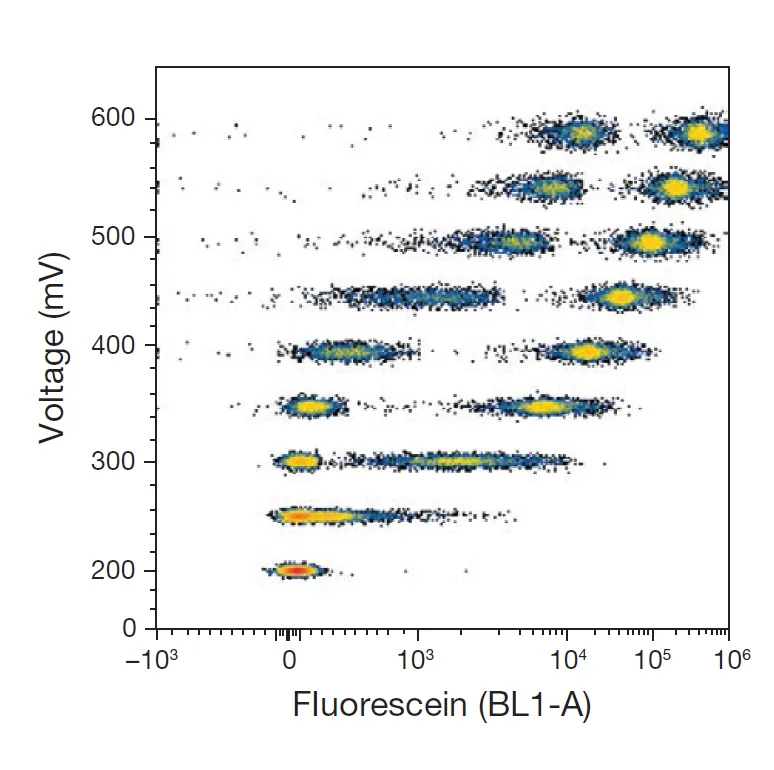
Figure 4. Impact of voltage on channel resolution
3.3 Standardized Voltage Optimization Strategy
The goal is to achieve clear separation between negative and positive populations while maintaining all signals within the linear detection range.
Recommended workflow:
• Run unstained or isotype control samples.
• Adjust voltage so that the negative population peak falls within 10⁰–10² on a logarithmic scale.
• Ensure no compression against the lower axis (no signal loss).
• Run positive controls (e.g., known positive cells or compensation beads).
• Confirm clear separation between positive and negative populations.
• Ensure positive signals are not saturated or clipped.
• Apply identical voltage settings across all samples in the same experiment.
Acceptance criteria:
• Proper positioning of negative population
• No signal truncation (lower or upper limits)
• Clear separation between populations
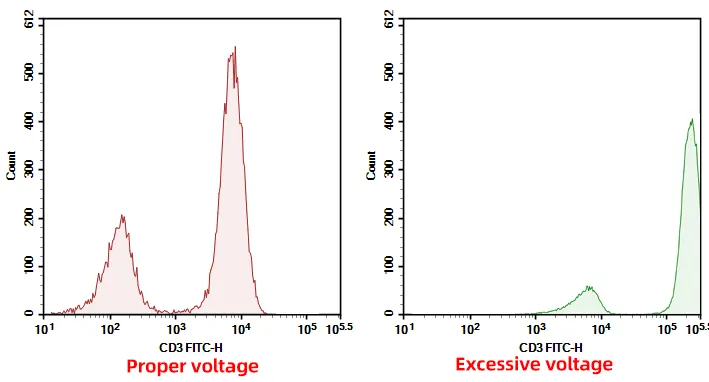
Figure 5. Proper vs. excessive voltage settings
4. Stopping Criteria: Defining When to End Acquisition
Stopping criteria determine when data acquisition should be terminated and ensure sufficient statistical power.
Common standardized criteria include:
| Experiment Type |
Stopping Condition |
Notes |
| Routine phenotyping |
≥10,000 events in target population |
Provides stable statistics for most analyses |
| Rare population detection (e.g., CTCs, dendritic cells) |
≥1,000 events in gate |
Ensures sufficient absolute counts |
| Absolute counting |
Fixed acquisition volume |
Cannot use event number; must use volume or counting beads |
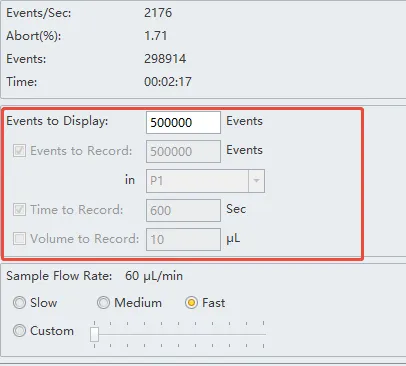
Figure 6. Flow cytometer stopping criteria interface example
All samples within the same batch must use identical stopping criteria to ensure data comparability.
5. Flow Rate: Balancing Throughput and Data Quality
5.1 Characteristics of Different Flow Rates
Flow rate, controlled by instrument pressure, determines the speed at which cells pass through the laser interrogation point:
• Low rate: Optimal fluidics stability; highest signal resolution
• Medium rate: Balanced performance; suitable for most routine experiments
• High rate: Increased throughput; reduced stability and higher coincidence rates
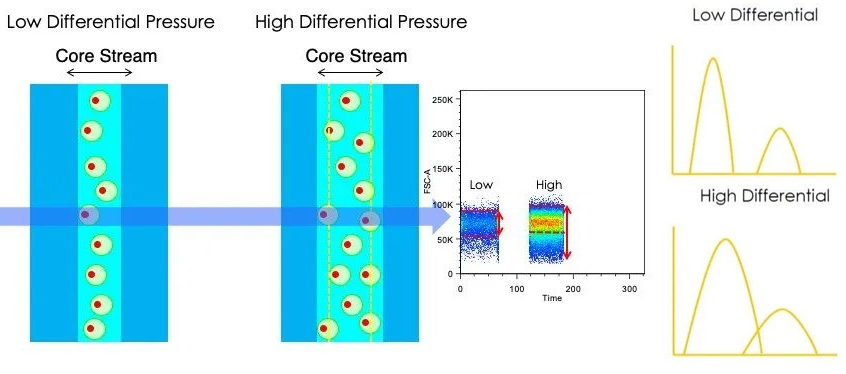
Figure 7. Effect of flow rate on data quality
5.2 Application Scenarios
| Flow Rate |
Suitable Applications |
Notes |
| High |
High-throughput screening of abundant, active samples |
Coincidence increases, resolution decreases, not for precise quantification |
| Medium |
Routine phenotyping |
Default choice when no special requirements |
| Low |
Weak signal detection, rare events, absolute counting, QC |
Maximizes data accuracy and resolution |
Key principle: higher sample concentration requires lower flow rates to minimize coincidence and aggregation, ensuring data integrity.
Conclusion
Flow cytometer parameter optimization is not an empirical adjustment process but a structured system centered on signal identification, amplification, and data reliability. From ensuring instrument stability through QC, defining event boundaries via threshold settings, optimizing signal distribution with PMT voltages, to controlling statistical robustness through stopping criteria and flow rate, each step directly impacts data quality.
In practice, the objective is not to achieve fixed parameter values but to establish a consistent and reproducible setup strategy tailored to sample characteristics and experimental goals. A well-controlled parameter framework minimizes batch-to-batch variability and enhances the reliability and interpretability of experimental results.
About Us
As a strategic venture of AtaGenix (established 2011), abinScience specializes in the development and production of high-quality life science reagents, and is committed to providing researchers with high-performance, highly reliable Flow Cytometry Antibodies, we offer:
1. Stringently validated flow cytometry antibodies including CD3, CD4, CD8 ensuring high sensitivity and minimal background noise;
2. A comprehensive portfolio of immunology research tools for multiple species, including Human, Mouse, Rat, Dog, Hamster, etc.;
3. Expert technical support and panel design consultation to help you accurately resolve complex immune cell populations.
For more information on abinScience flow cytometry antibodies, please visit:
abinScience Flow Cytometry Antibodies

 中文
中文 English
 한국어
한국어 日本語
日本語 Español
 Français
 Русский