Fecha de lanzamiento:
2025-12-16 Número de visitas: 169
In multicolour flow cytometry, accurately interpreting the spectral graph of fluorochromes is fundamental to the success of the experiment. With the advancement of technology, the use of multicolour applications in flow cytometry has become increasingly prevalent, and spectral graphs now play an ever more critical role in fluorochrome selection and experimental design. This raises the question: How can we properly understand and interpret spectral graphs to select the most suitable fluorochrome combinations?
1. Key Parameters of a Spectral Graph and Their Significance
What data should we focus on when interpreting a spectral graph? The first point of interest is the axes: the horizontal axis represents the wavelength, while the vertical axis typically indicates fluorescence intensity, often presented as a relative value that reflects the strength of emitted light at each wavelength. Next, we have the excitation (Ex) spectrum and the emission (Em) spectrum, which indicate the range of wavelengths at which a fluorochrome is excited and emits light, respectively. Lastly, the Ex Max and Em Max values indicate the fluorochrome’s peak excitation and emission wavelengths, which help determine the laser and detection channel best suited for the fluorochrome on a flow cytometer.
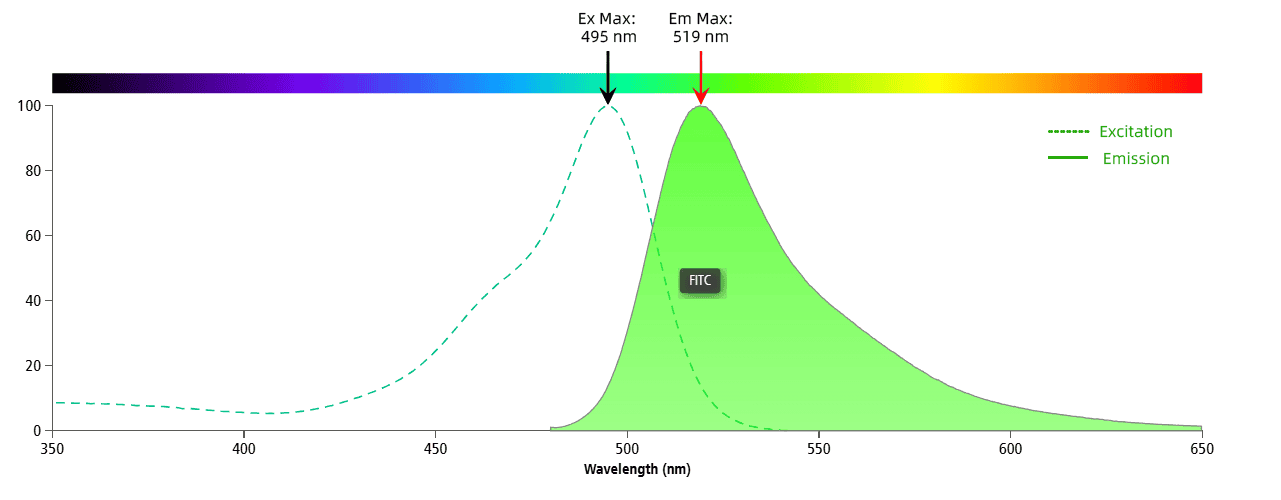
Figure 1. FITC Spectral Graph
Figure 1 illustrates the spectral graph of FITC. The dashed line represents the excitation spectrum, while the solid line shows the emission spectrum. FITC’s peak excitation is at 495 nm, with a peak emission at 519 nm. The optimal laser for FITC on a flow cytometer is 488 nm, and the best detection channel is typically around 519 nm (often using a 530/30 filter).
2. Assessing Fluorochrome Compatibility in Multicolour Panels Based on Spectral Graphs
2.1 Examining Fluorochrome Emission Spectra
If the emission spectra of two fluorochromes do not overlap significantly, they can be compatible within a single panel. For example, as shown in Figure 2, the emission spectra of different fluorochromes can be distinct enough to ensure compatibility in one panel.
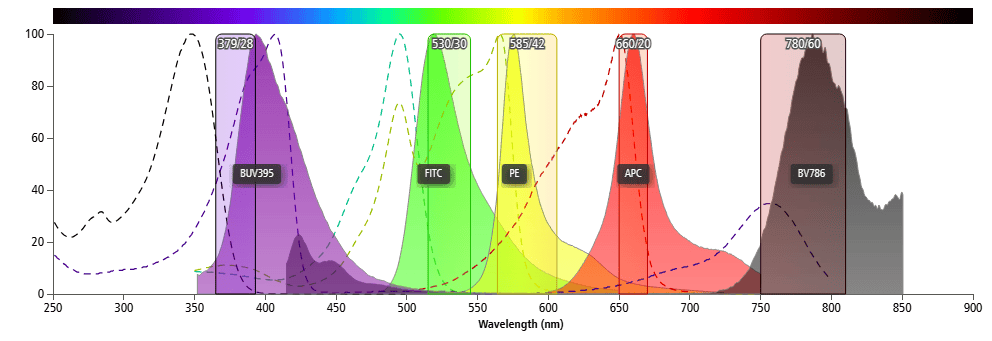
Figure 2. Spectral Graphs of Different Fluorochromes
2.2 Minor Overlap in Excitation Spectra but Significant Overlap in Emission Spectra
Fluorochromes that have significant overlap in their emission spectra but minimal overlap in excitation spectra can still be used in the same panel. An example of this is FITC and BV510, as shown in Figure 3. These two fluorochromes have a major overlap in their emission spectra but have minimal overlap in their excitation spectra, which allows them to use different lasers.
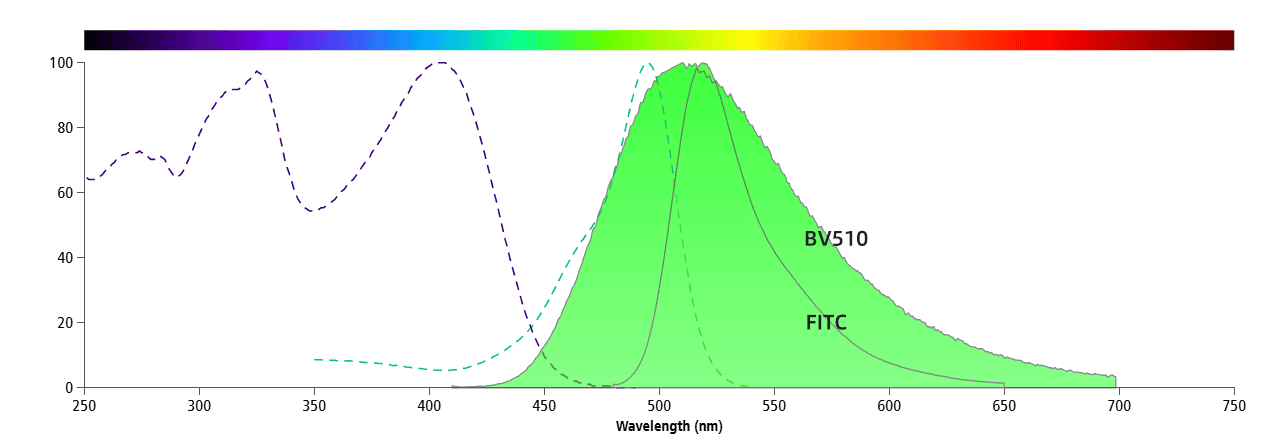
Figure 3. Spectral Graphs of FITC and BV510
FITC is excited by a 488 nm laser, while BV510 is excited by a 405 nm laser. A 405 nm laser can weakly excite FITC (Figure 4), and a 488 nm laser barely excites BV510 (Figure 5). Therefore, these two fluorochromes can be used together in the same panel.
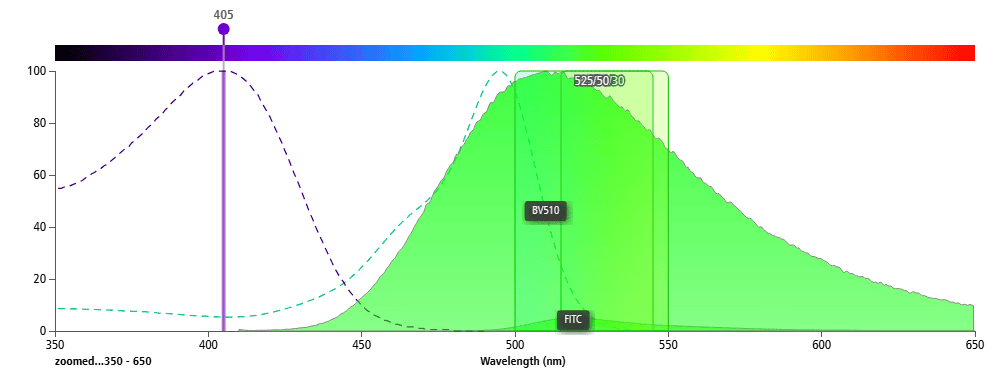
Figure 4. 405 nm Laser Exciting BV510 and FITC
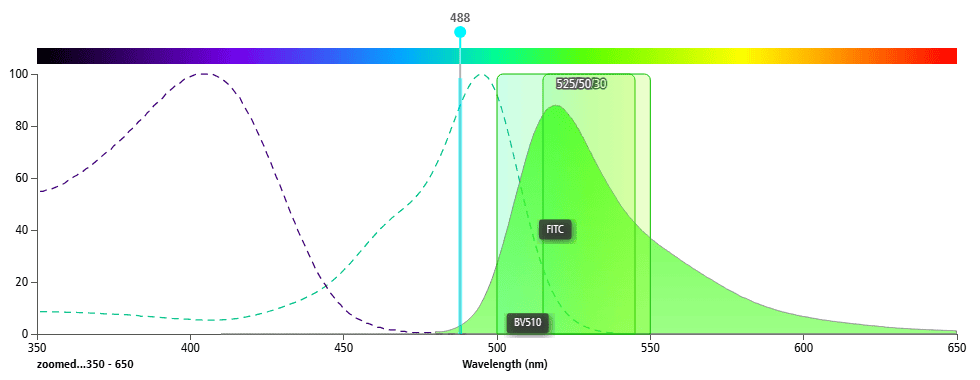
Figure 5. 488 nm Laser Exciting BV510 and FITC
2.3 Severe Overlap in Both Excitation and Emission Spectra
Fluorochromes with significant overlap in both their excitation and emission spectra should not be used in the same panel. For example, FITC, AF488, and GFP have nearly identical excitation and emission spectra (Figure 6) and should not be used together. This is particularly important when working with samples that exhibit GFP autofluorescence, as the use of FITC/AF488 would interfere with detection.
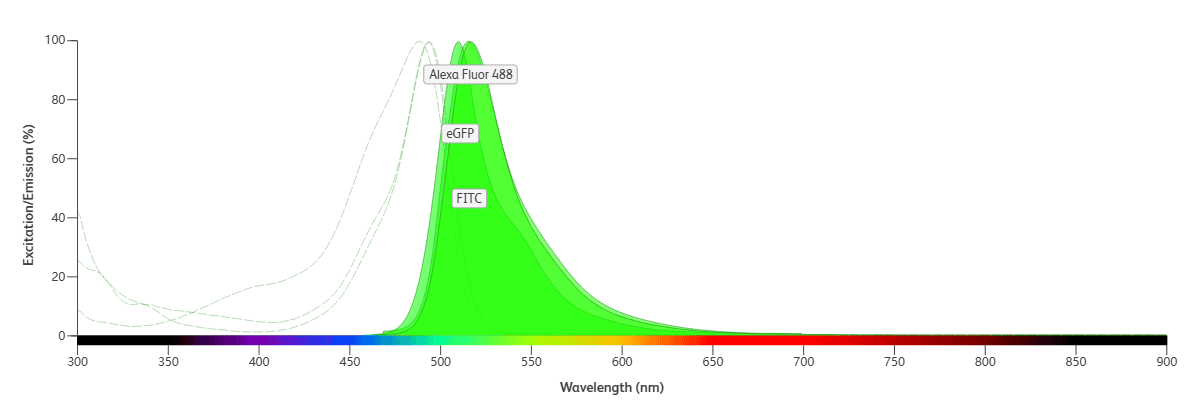
Figure 6. Fluorochromes with Severe Overlap in Both Excitation and Emission Spectra
By comparing the excitation and emission spectra of different fluorochromes, one can easily assess their compatibility. The general rule is: the smaller the overlap in the emission spectra, the better the compatibility (e.g., FITC and APC). If there is significant overlap in the emission spectra but minimal overlap in the excitation spectra, the compatibility improves (e.g., BV421 and BV750). Conversely, if both the excitation and emission spectra overlap significantly, the fluorochromes are less compatible (e.g., FITC and AF488).
3. Using Spectral Graphs to Find Alternative Fluorochromes
In some cases, due to insufficient brightness, equipment mismatches, or other reasons, a chosen fluorochrome may not be usable. In such cases, spectral graphs can help identify suitable alternative fluorochromes.
When selecting a substitute fluorochrome, the general principle is that the excitation and emission spectra of the substitute should closely match those of the original fluorochrome, with minimal overlap with other fluorochromes' emission spectra. Additionally, the brightness and stability of the fluorochrome should be considered to ensure clear signals during the experiment. For example, when working in slightly acidic conditions, FITC fluorescence may be quenched. In this case, AF488 can be used as an alternative, as their spectral properties are very similar, but AF488 is more stable under various pH and light conditions.
Table 1. Comparison of FITC and AF488
|
Fluorochrome
|
Brightness
|
Characteristics
|
|
FITC
|
Moderate
|
Sensitive to pH changes and light exposure, fluorescence is relatively dim, best paired with highly expressed antigens.
|
|
AF488
|
Moderate
|
More stable than FITC under varying pH and light conditions.
|
4. Selecting Suitable Fluorochromes Based on Spectral Graphs and Flow Cytometer Configuration
In addition to the spectral properties of the fluorochromes, the configuration of the flow cytometer should also be considered. Different instruments have varying laser configurations and detection channels, so it is essential to ensure that the fluorochromes selected are compatible with the available instrumentation.
4.1 Matching Lasers to Fluorochromes
First, determine the wavelengths of the lasers available on the flow cytometer. Fluorochromes must match the wavelengths of the available lasers. For instance, if the instrument does not have a 405 nm laser, any fluorochromes requiring that wavelength for excitation cannot be used. Table 2 shows common laser types used in flow cytometry along with the fluorochromes that can be excited by each laser.
Table 2. Common Flow Cytometry Lasers
|
Laser
|
Wavelength
|
Common Fluorochromes
|
|
UV
|
355 nm
|
DAPI, Hoechst, LIVE/DEAD Blue, BUV series
|
|
Violet
|
405 nm
|
Pacific Blue, eFluor 450, Pacific Orange, eFluor 506, Super Bright series, BV series
|
|
Blue
|
488 nm
|
FITC, Alexa Fluor 488, Dylight 488, PE, PE tandems, PerCP, PerCP tandems, PI, 7AAD, eGFP, YFP
|
|
Green
|
532 nm
|
PE, PE tandems, Alexa Fluor 532, PI, mCherry, RFP
|
|
Yellow
|
561–568 nm
|
PE, PE tandems, PI, mCherry, RFP
|
|
Red
|
633–647 nm
|
APC, Alexa Fluor 647, Alexa Fluor 700, APC tandems
|
4.2 Selecting Detection Channels
Each detection channel on the flow cytometer is equipped with specific optical filters that can only detect fluorescence within certain wavelength ranges, such as 530/30, which detects fluorescence around 530 nm ± 15 nm. Therefore, it is essential to select fluorochromes that match the central wavelength of the detection channels. Typically, a fluorochrome should be detected in a channel near its emission peak.
In conclusion, mastering the interpretation of spectral graphs is not only a technical prerequisite for designing multicolour panels but also a critical step in enhancing experimental accuracy and efficiency. In practice, spectral information should be integrated with instrument configurations, fluorochrome properties, and experimental goals. This integrated approach ensures optimal fluorochrome selection, thereby ensuring robust and reliable experimental outcomes in multicolour flow cytometry.
About Us
As a strategic venture of AtaGenix (established 2011), abinScience was founded in 2023 to deliver premium life science reagents that accelerate discovery. Our flow cytometry antibody products cover commonly used detection markers, with a wide variety to meet the research needs of multiple species (Human, Mouse, Rat, Dog, Hamster, Monkey, etc.). We provide stable and reliable support for scientific research. For more information on abinScience flow cytometry antibodies, please click:
abinScience Flow Cytometry (FACS) Antibodies

 中文
中文 English
 한국어
한국어 日本語
日本語 Español
 Français
 Русский


