In intracellular cytokine staining (ICS) assays, researchers frequently encounter puzzling variability: using the same batch of samples, identical protocols, and the exact same flow cytometry panel, the detected IFN-γ positivity rate might reach 30% today but drop to 10% tomorrow. When such fluctuations occur, after ruling out technical factors like antibody performance, the integrity of the Fixation/Permeabilization system, or multicolor panel design, the root cause often traces back to the pre-staining steps: in vitro stimulation and protein transport inhibition.
Unlike surface markers such as CD3, CD4, or CD8, which are constitutively and stably expressed, cytokines are not fixed cellular components. Rather, they are functional, dynamic effector molecules synthesized and released within specific time windows following cellular activation. Consequently, the cytokine signal detected by flow cytometry does not represent the cumulative total of cytokines produced by a cell, but rather the fraction retained intracellularly and captured by antibodies at the precise moment the assay is stopped. In short, ICS assay results reflect a dynamic equilibrium: stimulation dictates how much cytokine is produced, while secretion inhibition determines how much cytokine is retained. A shift in either parameter can significantly skew the final readout.
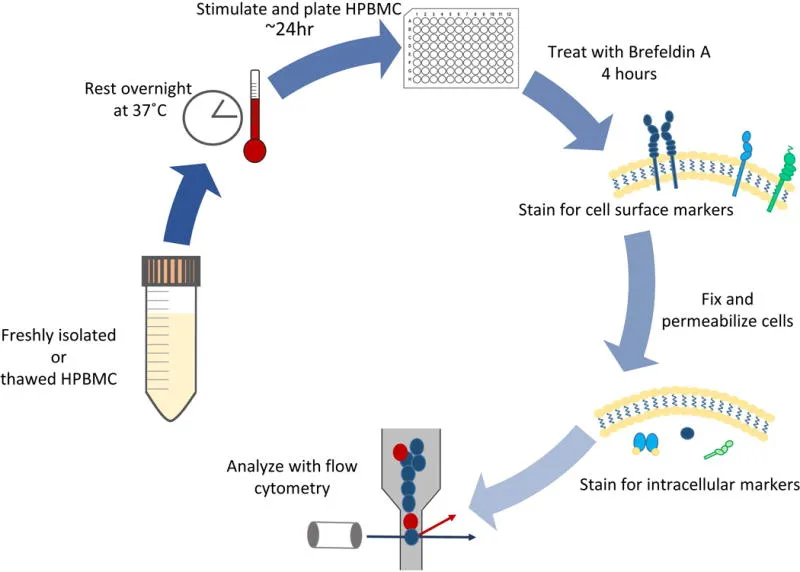
Figure 1. Workflow for intracellular cytokine detection in isolated human peripheral blood mononuclear cells (PBMCs) (DOI: 10.1002/cptx.26)
Under steady-state conditions, resting immune cells express low to undetectable baseline levels of cytokines; transcription and protein synthesis must be triggered by exogenous activating signals. Therefore, an ICS protocol must first include a stimulation step capable of inducing target cells to produce cytokines, establishing the baseline source and upper limit of the signal.
Once synthesized following stimulation, cytokines naturally transit through the Golgi apparatus and are secreted into the extracellular space. ICS assays rely on protein transport inhibitors to interrupt this pathway, temporarily trapping cytokines within the cell so they can be recognized by fluorochrome-conjugated antibodies. Stimulation defines the potential output, while inhibition ensures signal retention—together, they define the critical temporal window for ICS assay success.
Table 1. Common Stimulants and Protein Transport Inhibitors
| Category | Name | Mechanism of Action | Recommended Applications |
|---|---|---|---|
| Stimulant | PMA + Ionomycin | PMA activates PKC; Ionomycin increases intracellular Ca2+, bypassing upstream TCR signaling | Robust non-specific activation; broadly applicable across various immune cell types with rapid onset |
| Anti-CD3 / Anti-CD28 | Mimics TCR and co-stimulatory signaling, activating ZAP-70 downstream pathways | Physiologically relevant T-cell activation; slower kinetics than PMA/Ionomycin | |
| LPS | Activates the TLR4 pathway on monocytes/dendritic cells | Ideal for monocyte-derived cytokines (e.g., TNF-α, IL-6) | |
| Antigen Peptide Pools / Whole Proteins | Requires antigen processing and presentation to activate antigen-specific T cells | Measures antigen-specific responses; slower onset, requires pre-incubation | |
| Inhibitor | Brefeldin A (BFA) | Blocks protein transport between the endoplasmic reticulum (ER) and Golgi | Standard choice for most cytokine assays; typical working concentration is 5–10 μg/mL |
| Monensin | Na+/H+ ionophore that disrupts Golgi transport; may induce cytokine expression in certain cell types | Commonly used for cell-surface degranulation markers (e.g., CD107a/b); less efficient than BFA for trapping certain cytokines |
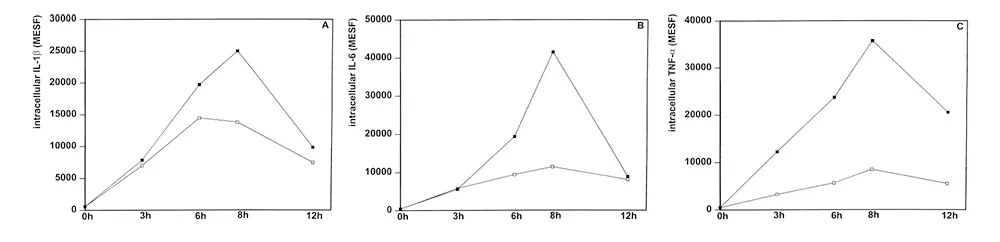
Figure 2. Impact of stimulation duration on cytokine detection (Open squares: 1 μg/mL LPS + 2 μmol/L monensin; Solid squares: 1.4 μmol/L brefeldin A) (DOI: 10.1002/cyto.1102)
Cytokine synthesis requires transcription, translation, and post-translational processing, introducing an inherent time lag. Following PHA or anti-CD3 stimulation, cytokine gene upregulation generally begins 1–4 hours post-activation, with mRNA levels peaking around 8 hours. If the stimulation duration is too short (e.g., 1–2 hours), most cytokines will not have accumulated to detectable levels. Even if cells are activated, the assay will yield false negatives or artificially low positive rates.
Different cytokines follow distinct secretion kinetics and do not simply accumulate indefinitely over time. For instance, TNF-α is an early-response cytokine, peaking shortly after activation and declining thereafter. Conversely, cytokines like IFN-γ and IL-2 require longer incubation times to reach peak intracellular levels. Consequently, there is no universal "one-size-fits-all" stimulation duration; timing must be tailored to the target cytokine.
Prolonging stimulation also risks compromising cellular integrity. Culture periods exceeding 6 hours—and particularly extending up to 24 hours—can significantly decrease detectable cell subset frequencies and impair overall cell viability.
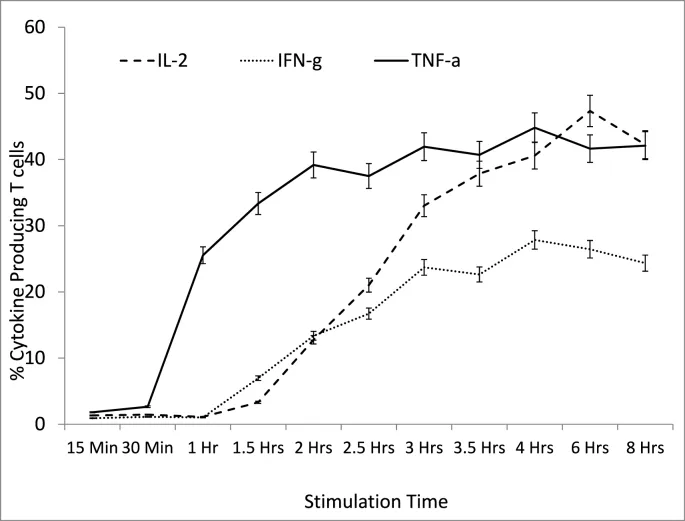
Figure 3. Percentage of T cells expressing IL-2, IFN-γ, and TNF-α at various time points after PMA and Ionomycin stimulation (DOI: 10.1016/j.crimmu.2021.10.002)
PMA/Ionomycin acts as a potent, non-specific stimulus with rapid onset, inducing detectable levels of most pro-inflammatory cytokines (IFN-γ, TNF-α, IL-2) within 5–6 hours. In contrast, antigen-specific stimulation (e.g., peptide pools or whole-protein antigens) relies on cellular uptake, processing, and MHC presentation, leading to delayed kinetics. Antigen-driven assays typically require a pre-incubation step (approx. 2 hours) to establish antigen presentation and early activation signaling before adding transport inhibitors like BFA or Monensin. Directly applying kinetic parameters optimized for PMA/Ionomycin to antigen-specific systems is a common source of experimental failure.
Table 2. Recommended Stimulation and Detection Parameters for Key Cytokines
| Cytokine | Common Stimulation Method | Recommended Total Duration | Kinetic Profile |
|---|---|---|---|
| TNF-α | PMA / Ionomycin | 4–6 hours | Rapid onset; peaks early (~2 hours) and declines rapidly thereafter |
| IFN-γ | PMA / Ionomycin or Antigen-specific | 5–8 hours (extendable for antigen stimulation) | Later peak (~8 hours); remains relatively stable for up to 24 hours |
| IL-2 | PMA / Ionomycin | 5–8 hours | Peaks at ~8 hours, followed by a noticeable decline |
| IL-4 | PMA / Ionomycin | ~6 hours | Similar to TNF-α and IFN-γ; effectively detectable by 6 hours |
| IL-13 | PMA / Ionomycin | Detectable from 2 hours | Early onset with sustained expression for up to 72 hours |
| IL-10 / TNF-β | PMA / Ionomycin or Antigen-specific | Up to 48 hours | Delayed-response cytokines; short stimulation risks false negatives |
Note: Parameters serve as baseline starting points. Optimization via kinetic time-course experiments is strongly recommended for specific cell types and stimulation systems.
Protein transport inhibitors function by shutting down cellular export pathways. However, distinct mechanistic targets between inhibitors dictate their trapping efficiency for specific cytokines as well as their cytotoxicity. The two primary inhibitors used are Brefeldin A (BFA) and Monensin.
| Brefeldin A (BFA) | Monensin | |
|---|---|---|
| Primary Target | Inhibits GBF1/ARF1 guanine nucleotide exchange factors | Na+/H+ ionophore |
| Golgi Effect | Causes Golgi disassembly and retrograde absorption into the ER | Disrupts transmembrane potential/pH gradients, causing Golgi cisternal swelling |
| Blockade Site | Anterograde transport from Endoplasmic Reticulum (ER) to Golgi | Vesicle budding and exocytosis at the Trans-Golgi Network (TGN) |
| Cytokine Preference | Highly effective for most classical cytokines (e.g., IFN-γ, TNF-α, IL-2) | Superior for specific glycoproteins/cytokines (e.g., IL-10) and degranulation assays (e.g., CD107a) |
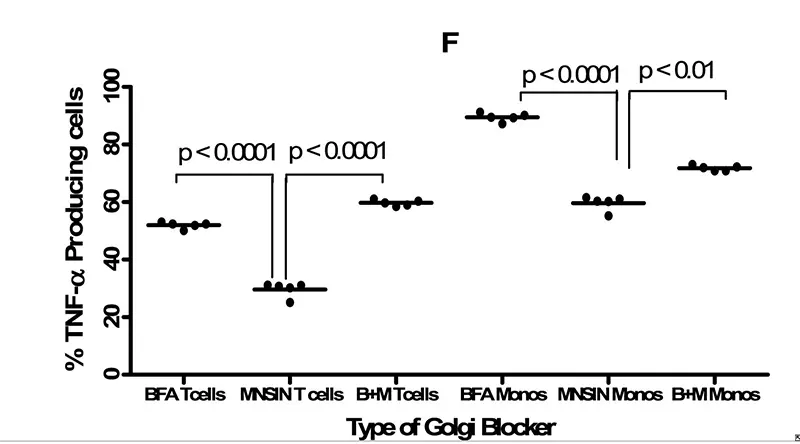
Figure 4. Effect of different transport inhibitors on the frequency of TNF-α-producing T cells and monocytes (DOI: 10.1016/j.crimmu.2021.10.002)
The timing of inhibitor addition marks the onset of secretion blockage and works interdependently with total stimulation time.
Adding inhibitors too early can impair early activation signaling and antigen processing/presentation, particularly in full-protein stimulation assays. For such systems, a ~2-hour pre-incubation period without inhibitors allows presentation and co-stimulation to fully occur prior to BFA/Monensin addition.
Adding inhibitors too late allows synthesized cytokines to escape into the supernatant, leading to systematic underestimation of positive populations—an issue particularly acute for fast-secreting cytokines like TNF-α.
A widely accepted protocol involves stimulating cells for 1–2 hours (extending pre-incubation to ~2 hours for protein antigens), adding BFA (5–10 μg/mL), and continuing culture for an additional 4–6 hours to ensure a 2–4 hour accumulation window. This framework provides a solid baseline but should be validated for specific target cytokines and activation conditions.
No. Secretion kinetics vary significantly across cytokines: TNF-α peaks at ~2 hours, IL-2 and IFN-γ peak at ~8 hours, and delayed cytokines like IL-10 or TNF-β may require up to 48 hours. Any time parameter is intrinsically tied to a specific stimulus-cytokine combination. We recommend using 5–6 hours as an initial reference point and performing a kinetic time-course experiment for new targets.
Not necessarily; co-treatment should be empirically validated per cytokine rather than assumed beneficial. As shown in Figure 4, BFA alone yields higher sensitivity than a BFA + Monensin combination for TNF-α detection.
This is a common trade-off in panel design. Standard strategies include prioritizing optimal windows for the primary 1–2 cytokines of interest while accepting sub-optimal signals for secondary targets. Alternatively, if kinetic profiles are highly divergent (e.g., TNF-α vs. IL-10), split the assay into separate stimulation conditions.
Yes, re-validation is strongly recommended, especially for stimulants (e.g., PMA/Ionomycin, peptide pools). Lot-to-lot potency variations can shift the optimal kinetic window or lead to sub-optimal stimulation. While a full kinetic course is not required for every batch change, running a parallel positive control to confirm consistency against historical baselines is best practice.
Assay instability in ICS flow cytometry rarely stems from a single experimental factor; more often, it results from failing to align experimental workflows with biological expression kinetics. Unlike stable surface markers, intracellular cytokine detection depends on a tightly synchronized temporal window between induction, accumulation, and detection.
Consequently, stimulation and secretion blockage should not be treated as independent variables, but as co-dependent parameters that dictate overall signal strength. Tailoring these parameters to the target cytokine, activation model, and experimental goal is essential for achieving reliable, reproducible data.
Understanding when cytokines are produced, when they are released, and how they are trapped is far more critical than merely fine-tuning antibody titration or staining protocols. When troubleshooting ICS assay fluctuations, re-evaluating stimulation and inhibition parameters will almost always uncover the solution.
abinScience was founded in 2023 as a strategic venture of AtaGenix (established 2011), dedicated to delivering premium life science reagents that accelerate discovery.
abinScience flow cytometry antibody products cover commonly used detection markers, with a wide variety to meet the research needs of multiple species(Human, Mouse, Rat, Dog, Hamster, Monkey, etc.)We provide stable and reliable support for scientific research.
+86-027-65523339
中国武漢市深敦寺路666号C棟、武漢、430206


 中文
中文 English
 한국어
한국어 日本語
日本語 Español
 Français
 Русский