In multicolor flow cytometry experiments, spectral overlap is an unavoidable fundamental issue, making compensation an essential routine for every researcher. A common misconception persists among many experimenters: as long as single-stain controls are valid and the compensation matrix is properly calibrated, a multicolor panel should naturally yield well-resolved cell populations.
However, in practice, many researchers encounter this frustrating scenario:
- ● Single-stain compensation controls are perfectly adjusted, and negative population medians are fully aligned.
- ● Antibody quality is consistent and staining protocols are properly executed.
- ● Yet, when analyzing actual sample data, dim/weakly expressed markers still show blurred boundaries between positive and negative populations.
- ● Population resolution in the multicolor panel falls far short of single-color performance.
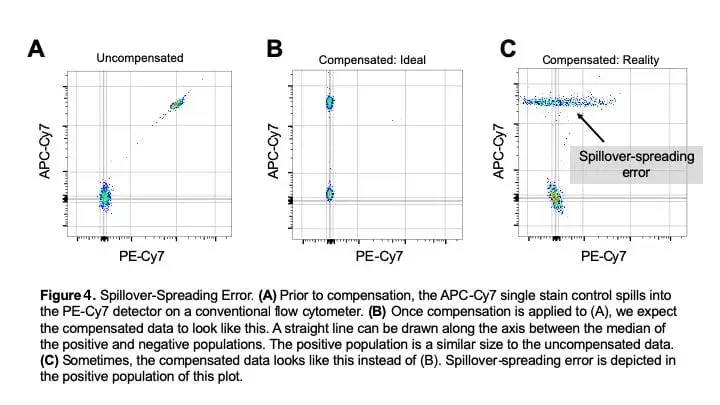
When this happens, it isn't necessarily due to a mistake in compensation. More likely, an invisible yet critical factor governing multicolor data quality has been overlooked: Spreading Error (also known as Spillover Spreading Error, SSE).
Understanding the nature and impact of Spreading Error is a crucial step in advancing from simply "knowing how to adjust compensation" to "knowing how to design high-quality panels."
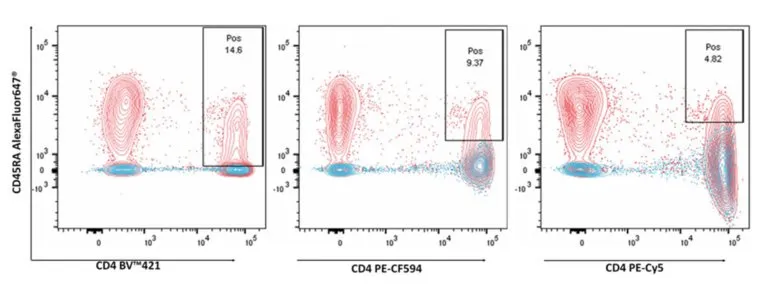
Figure 1. Spreading Error leading to reduced separation of positive populations
1. What Does Compensation Solve? Why Isn't It a Panacea?
1.1 Spectral Overlap: The Prerequisite for Compensation
Fluorochromes used in flow cytometry generally emit light over a broad spectrum rather than at a single wavelength. Consequently, when a fluorochrome is excited, a portion of its emitted light may spill over into neighboring detection channels—a phenomenon known as spectral spillover.
For example, while PE has a primary emission peak around 575 nm, its emission spectrum extends into adjacent detection channels, generating extra signal in neighboring channels. Left uncorrected, this spillover elevates the overall fluorescence intensity in those channels, compromising accurate cell population gating. Compensation was developed precisely to address this issue.
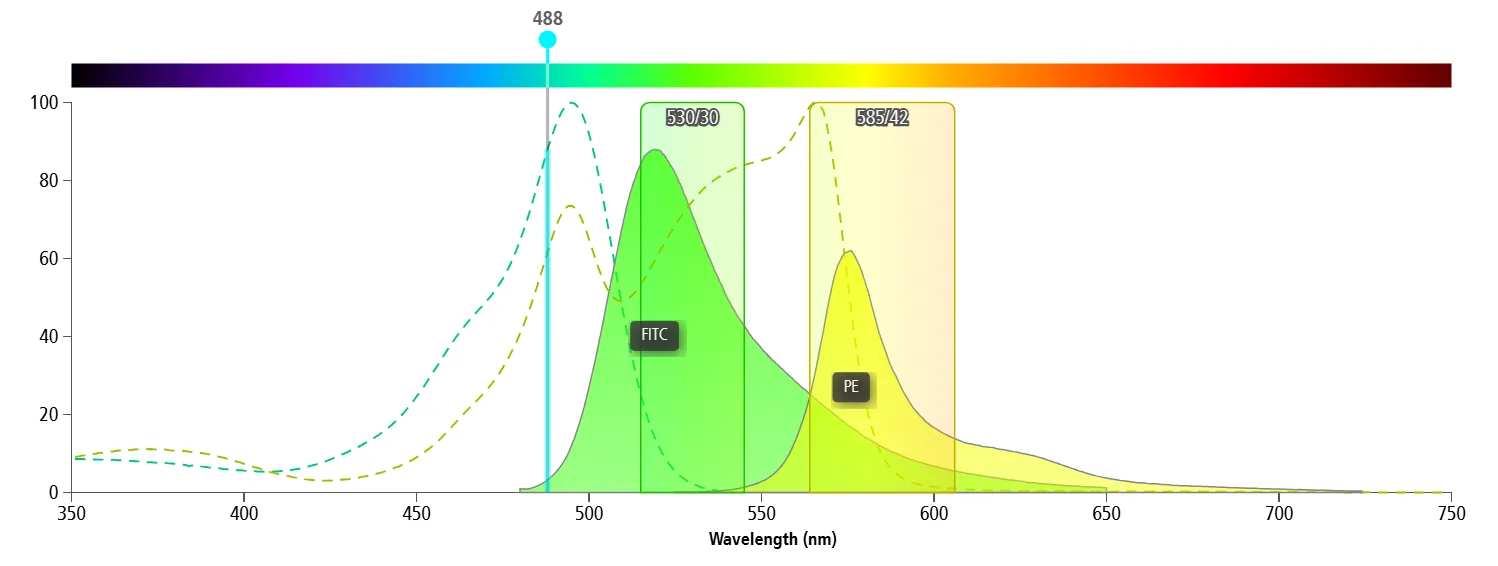
Figure 2. Spectral Overlap
1.2 The Essence of Compensation: Correcting Mean Signal Shift
Mathematically, compensation is a signal correction method based on single-stain controls. It calculates the spillover coefficient of a fluorochrome into other channels and quantitatively subtracts this extra signal, restoring the median fluorescence intensity (MFI) of the negative population to its true baselineIn short, compensation resolves the issue of population mean shift—it pulls the negative population (which was artificially elevated by spillover) back to where it belongs.
1.3 The Limits of Compensation: Unresolvable Signal Variance
However, compensation cannot fix everything. The impact of fluorescence spillover is not merely a fixed signal increment. In real-world fluorescence detection, the signal emitted by each individual cell naturally varies due to:
- ● Differences in fluorochrome abundance per cell;
- ● Stochastic fluctuations during photon emission and detection;
- ● Measurement noise intrinsic to the instrument detection system.
Thus, when a bright fluorescent signal spills over, it carries not only its mean signal into adjacent channels but also the additional variance inherent to those signal fluctuations.
While compensation can correct the average shift caused by spillover, it cannot eliminate population broadening caused by the propagation of signal variance. This phenomenon is Spreading Error.
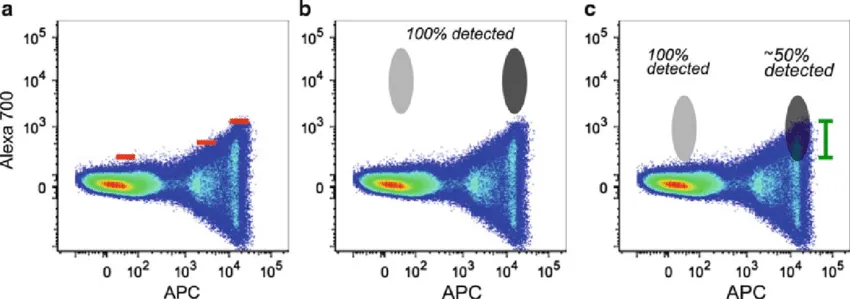
Figure 3. Spreading Error (DOI: 10.1007/978-1-4939-6548-9_3)
2. What is Spreading Error?
2.1 From "Signal Leakage" to "Signal Spreading"
Many researchers view spectral overlap simply as "signal from one color leaking into another channel" and assume that subtracting this signal fixes everything. But real detection is more complex.
Fluorescence signals detected by a flow cytometer are essentially measurements of photon counts. Photon emission follows a Poisson distribution, which inherently exhibits statistical variation. Combined with instrument noise and variations in fluorochrome intensity, the signal for each cell is a fluctuating value, not a static number.
When a bright fluorochrome spills over, it brings into the adjacent channel not just a fixed increment of signal, but also its accompanying statistical noise. The brighter the signal and the higher the photon count, the larger the magnitude of statistical variance—causing the tightly distributed negative cell population to broaden significantly and increasing data dispersion. This broadening of population distribution driven by statistical fluctuations in signal is known as Spreading Error (SE) or Spillover Spreading Error (SSE).
2.2 Why Can't Compensation Eliminate Spreading Error?
Spreading Error is an inherent physical property of fluorescence detection, not an artifact created by compensation. The mathematical logic of compensation is strictly designed to subtract the mean spillover signal; it cannot erase underlying statistical errors.From a detection standpoint, photon counting by photomultiplier tubes (PMTs) follows Poisson statistics, carrying intrinsic random fluctuations. For example, if a fluorochrome emits 1,000 photons and the PMT quantum efficiency is 40%, the theoretical detection value is 400 photons. However, actual measurements will fluctuate roughly between 370 and 430 photons. This signal fluctuation is Spreading Error, and its magnitude scales proportionally with the square root of signal intensity. In bright positive populations, this error relative to the total signal is minimal and practically invisible. Nevertheless, it is always present—regardless of whether compensation is applied or spillover exists.
When fluorescence spills over, its associated statistical noise enters the adjacent channel alongside the signal. Compensation performs a linear subtraction of the average spillover, returning the negative population to baseline, but it cannot strip away the imported statistical variance. Crucially, once compensation pulls the overall signal level of the negative population back to baseline, the relative impact of this residual error becomes disproportionately large. Visually, this manifests as a widened negative population, an increased CV, and potential tailing, directly diminishing population resolution in that channel.
3. Why Is Spreading Error Particularly Severe for Low-Expression Markers?
Spreading Error is present in all multicolor experiments, but not all target markers are equally affected. The extent of its impact primarily depends on the distance between the positive signal and the negative background.
3.1 High-Expression Markers: Negligible Impact
For lineage markers like CD4, CD8, and CD19, antigen expression is high. The fluorescence intensity of the positive population is orders of magnitude above the negative background, creating a wide resolution window. Even if strong fluorescence in an adjacent channel broadens the negative population slightly, the positive population remains cleanly separated, making Spreading Error virtually imperceptible.
3.2 Low-Expression Markers: The Hidden Culprit Behind Poor Resolution
Conversely, for immune checkpoints like PD-1, TIM-3, and TIGIT, as well as activation markers or rare cell subset markers, antigen expression levels are low. The signal intensity of the positive population is only slightly above the negative background, resulting in a narrow resolution window.
When the target channel suffers from Spreading Error imparted by a bright fluorochrome in an adjacent channel, the negative population expands further, potentially overlapping with weak positive signals. This is the root cause of the common dilemma: "Compensation is perfectly adjusted, so why can't I resolve my dim marker?"
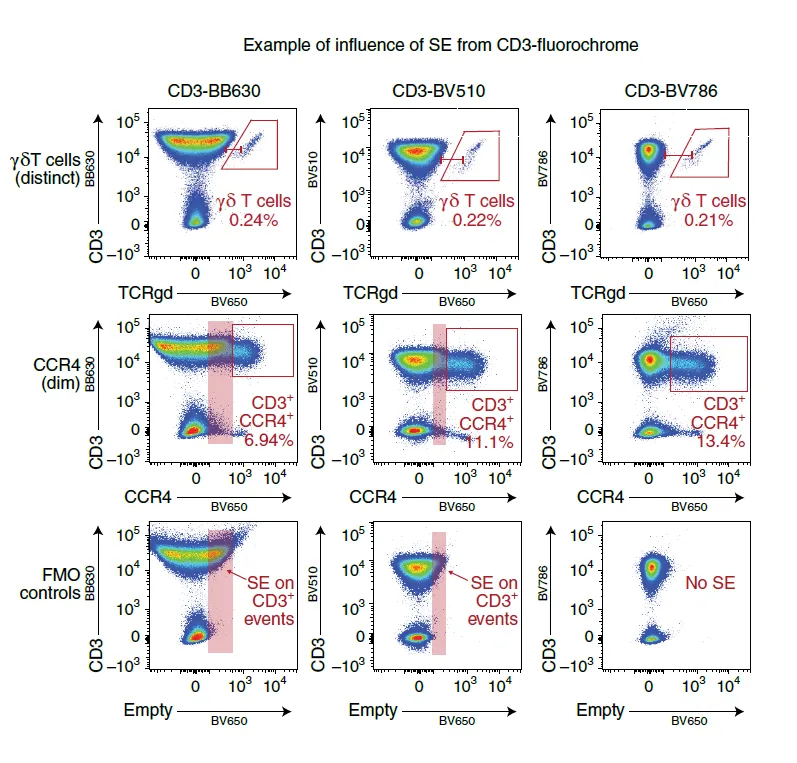
Figure 5. Fluorochromes chosen for the T-cell lineage marker CD3 affect the resolution of weak or continuous antigen expression across three detectors. In a poorly designed panel, SE conceals nearly half of the true CCR4+ cell population. (DOI: 10.1038/s41590-021-01006-z)
3.3 Misconception Debunked: The Brightest Fluorochrome Isn't Always Best
A common assumption during panel design is that brighter fluorochromes are always better because stronger signals reduce error. While generally true in single-color experiments—where brighter fluorochromes increase the stain index—the scenario changes in multicolor cytometry.
Bright fluorochromes boost their own signal intensity but also induce greater spreading error into adjacent channels. Blindly assigning bright fluorochromes to highly expressed markers can inflict severe Spreading Error on neighboring channels assigned to dim, critical targets, ultimately degrading overall panel performance.
Panel design is never about blindly stacking brightness; it is a balance between signal intensity and cross-channel spillover—a core principle of robust multicolor panel design.
4. Which Experimental Scenarios Are Most Vulnerable to Spreading Error?
4.1 High-Dimensional Multicolor Panels
As the number of detection channels grows, adjacent fluorochrome relationships become increasingly complex. A single bright fluorochrome can simultaneously affect multiple flanking channels, compounding spreading errors. In panels with >10 colors, Spreading Error becomes a primary bottleneck limiting data resolution and can even introduce spurious heterogeneity in dimensionality reduction analyses (e.g., t-SNE/UMAP).
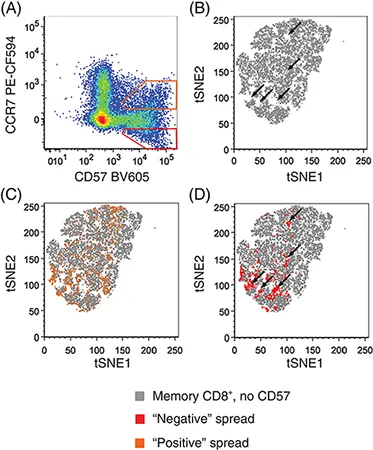
Figure 6. Impact on variability in t-SNE high-dimensional data visualization (DOI:10.1002/cyto.a.23566)
4.2 Low-Expression Target Detection
Low-abundance targets—such as immune checkpoints, activation markers, chemokine receptors, and rare cell populations—have small signal differences between positive and negative populations. They are exquisitely sensitive to background widening and require careful consideration of spreading error during panel design to avoid compromising sensitivity.
4.3 Adjacent Combinations of High- and Low-Expression Markers
Assigning bright fluorochromes (e.g., PE, APC) to high-expression targets while placing low-expression targets in adjacent channels allows strong spreading error to bleed directly into weak-target channels, blurring population gates. This is one of the most common pitfalls in multicolor panel design.
4.4 Clustering of Bright Fluorochromes
Fluorochromes like PE and APC are popular due to their high brightness and ability to boost sensitivity for dim markers. However, clustering multiple bright fluorochromes with strong mutual interference elevates background spreading across the panel. Optimal panel design balances fluorochrome brightness, antigen density, channel interaction, and instrument configuration.
5. How to Minimize Spreading Error in Panel Design?
While Spreading Error is an inescapable physical attribute of photon detection, its impact can be minimized through deliberate panel design and experimental planning.
5.1 Match Fluorochrome Brightness to Antigen Expression Levels
Adhere to the rule: Pair highly expressed markers with moderate-to-dim fluorochromes, and reserve bright fluorochromes for low-expression markers.
- ● Abundant lineage markers such as CD45 and CD3 do not require high-brightness fluorochromes such as PE and APC; moderate-brightness fluorochromes suffice for distinct separation.
- ● Reserve high-brightness fluorochromes for challenging, low-expression targets (e.g., PD-1, transcription factors) to maximize the separation between positive signal and background, counteracting spreading error.
5.2 Isolate Critical Targets from Channels Adjacent to Bright Fluorochromes
Do not rely solely on "percent spectral overlap" when evaluating panel feasibility; proactively assess spreading error impact:
- ● Identify the 1–2 brightest fluorochromes in the panel and place them at channel extremes to minimize bidirectional spreading.
- ● Position critical dim targets in channels flanked by low-brightness fluorochromes to avoid being sandwiched by high spreading errors.
5.3 Use FMO Controls to Assess True Population Resolution
Single-stain controls calibrate compensation but cannot reflect the cumulative impact of spreading error. To evaluate the true resolving power of a multicolor panel, Fluorescence Minus One (FMO) controls are essential.
An FMO control contains all panel antibodies except one, revealing the combined spillover and spreading error imposed by all other fluorochromes on the open channel. This allows accurate definition of negative population boundaries and proper gate placement, preventing false positives/negatives. FMO controls are indispensable for dim markers and high-dimensional panels.
6. Can Spectral Flow Cytometry Completely Eliminate Spreading Error?
With the growing adoption of spectral flow cytometry, a common question arises: Does spectral cytometry eliminate Spreading Error since it uses full-spectrum unmixing instead of traditional compensation?
The answer is no. Spectral flow cytometry analyzes complete emission profiles across detector arrays, allowing precise signal unmixing and reducing traditional compensation artifacts. However, the ultimate source of Spreading Error is Poisson photon counting noise—a fundamental physical property present in all optical systems regardless of whether compensation or spectral unmixing is used. Wherever bright fluorescence signals exist, photon fluctuations generate spreading error. Furthermore, spectral unmixing matrices introduce distinct unmixing-dependent spreading that broadens negative population distributions.
Table 1. Comparison of Spreading Error Mechanisms and Mitigation Strategies across Cytometry Platforms
| |
Conventional Flow Cytometry |
Spectral Flow Cytometry |
| Detection Principle |
Uses bandpass filters and dedicated PMTs/detectors to measure specific portions of a fluorochrome's emission spectrum. |
Captures full emission spectra across multi-detector arrays covering the entire wavelength range. |
| Causes of Spreading Error |
Emission spectra overlap, spilling into adjacent channels. The intrinsic Poisson photon noise of the spillover signal propagates into the target channel, broadening population distributions. Compensation adjusts mean values but cannot remove statistical noise, making spreading more evident in negative populations. |
Spectral unmixing significantly reduces spillover-induced spreading but cannot eliminate Poisson photon noise. Detector dark noise and unmixing matrix limitations also introduce additional signal dispersion, maintaining Spreading Error. |
| Mitigation Strategies |
1. Scientific Panel Design: Match fluorochrome brightness to antigen density; keep dim targets away from bright adjacent channels.
2. FMO Controls: Evaluate true background spread for accurate gating.
3. Instrument Optimization: Tune PMT voltages and gains to balance sensitivity and background noise.
|
1. Optimize Spectral Unmixing: Use high-quality single-stain controls to build precise unmixing matrices.
2. Fluorochrome Selection: Choose fluorochromes with distinct spectral signatures to ease unmixing.
3. Hardware Optimization: Use low-noise detectors to reduce instrument baseline noise contribution.
|
Therefore, whether using conventional or spectral cytometry, the core principles of panel design remain paramount: balancing antigen density, fluorochrome brightness, and channel layout is essential for achieving optimal population resolution.
Summary
Compensation is a foundational step in multicolor flow cytometry, but it is not a cure-all for data quality issues. It corrects mean signal shifts from spectral spillover but cannot eliminate the statistical variance in photon detection that causes Spreading Error.
When facing "correct compensation yet poor resolution"—especially with dim markers or high-dimensional panels—re-evaluate your panel design through the lens of Spreading Error. Moving beyond "looking only at spectral overlap" to master spreading error mechanics is the key to designing high-resolution, dependable flow panels—marking the transition from simply running assays to mastering panel design.
Looking for Reliable Flow Cytometry Antibodies to Support your Experimental Workflows?
abinScience Flow Cytometry Antibodies are subjected to rigorous quality control to ensure consistent fluorescent performance and clear discrimination of cell populations, supporting robust and reproducible flow cytometry analyses.
Learn More about abinScience Flow Cytometry Antibodies
About Us
abinScience was founded in 2023 as a strategic venture of AtaGenix (established 2011), dedicated to delivering premium life science reagents that accelerate discovery.
abinScience flow cytometry antibody products cover commonly used detection markers, with a wide variety to meet the research needs of multiple species(
Human,
Mouse,
Rat,
Dog,
Hamster,
Monkey, etc.)We provide stable and reliable support for scientific research.

References
- [1] Mazza, E. M. C., Brummelman, J., Alvisi, G., Roberto, A., De Paoli, F., Zanon, V., Colombo, F., Roederer, M., & Lugli, E. (2018). Background fluorescence and spreading error are major contributors of variability in high-dimensional flow cytometry data visualization by t-distributed stochastic neighboring embedding. Cytometry. Part A : the journal of the International Society for Analytical Cytology, 93(8), 785–792. https://doi.org/10.1002/cyto.a.23566
- [2] Roederer M. (2001). Spectral compensation for flow cytometry: visualization artifacts, limitations, and caveats. Cytometry, 45(3), 194–205. https://doi.org/10.1002/1097-0320(20011101)45:3<194::aid-cyto1163>3.0.co;2-c
- [3] Nguyen, R., Perfetto, S., Mahnke, Y. D., Chattopadhyay, P., & Roederer, M. (2013). Quantifying spillover spreading for comparing instrument performance and aiding in multicolor panel design. Cytometry. Part A : the journal of the International Society for Analytical Cytology, 83(3), 306–315. https://doi.org/10.1002/cyto.a.22251
- [4] Niewold, P., Ashhurst, T. M., Smith, A. L., & King, N. J. C. (2020). Evaluating spectral cytometry for immune profiling in viral disease. Cytometry. Part A : the journal of the International Society for Analytical Cytology, 97(11), 1165–1179. https://doi.org/10.1002/cyto.a.24211
- [5] Mage, P. L., Konecny, A. J., & Mair, F. (2025). Measurement and prediction of unmixing-dependent spreading in spectral flow cytometry panels. bioRxiv : the preprint server for biology, 2025.04.17.649396. https://doi.org/10.1101/2025.04.17.649396
- [6] Liechti, T., Weber, L. M., Ashhurst, T. M., Stanley, N., Prlic, M., Van Gassen, S., & Mair, F. (2021). An updated guide for the perplexed: cytometry in the high-dimensional era. Nature immunology, 22(10), 1190–1197. https://doi.org/10.1038/s41590-021-01006-z
- [7] Lugli, E., Zanon, V., Mavilio, D., & Roberto, A. (2017). FACS Analysis of Memory T Lymphocytes. Methods in molecular biology (Clifton, N.J.), 1514, 31–47. https://doi.org/10.1007/978-1-4939-6548-9_3


 中文
中文 English
 한국어
한국어 日本語
日本語 Español
 Français
 Русский