In flow cytometry, antibody stability directly dictates the accuracy and reproducibility of experimental results. In practical applications, it may occur that a single vial of flow cytometry antibody gradually exhibits weakened fluorescence signals, decreased resolution between positive and negative populations, or poorer experimental reproducibility over prolonged storage or increased usage
The underlying causes of altered staining signals are multifaceted, involving antibody performance changes, sample conditions, instrument parameters, and experimental operations. Therefore, when inconsistent results are observed with the same vial of antibody across sequential experiments, a systematic and logical troubleshooting workflow is the most efficient strategy to identify the root cause.
I. Factors Contributing to Decreased Flow Cytometry Staining Signals
Flow cytometry outcomes are a cumulative reflection of multiple steps—from sample preparation and antibody staining to data acquisition and analysis. Any deviation can impact the final signal. Common variables include:
1. Changes in Antibody Performance
During long-term storage and repeated handling, antibodies are exposed to temperature fluctuations, light exposure, microbial contamination, and mechanical stress. These factors can induce antibody denaturation or breakage of fluorophore conjugation bonds, which manifests as reduced mean fluorescence intensity (MFI) of the positive population, impaired detection sensitivity for low-abundance antigens, or even complete loss of resolution between positive and negative populations.
Special attention should be paid to antibodies conjugated to PE, APC, and their tandem dyes. Unlike small-molecule fluorophores like FITC or Alexa Fluor, these macromolecular protein dyes are highly sensitive to temperature, light, and agitation. Tandem dyes, in particular, are prone to donor-acceptor dissociation over long-term storage. This degrades Fluorescence Resonance Energy Transfer (FRET) efficiency, which not only dims the target channel signal but can also cause aberrant fluorophore spillover into the donor channel, complicating compensation settings.
2. Sample Condition Changes
The physiological state and processing quality of samples are core variables that determine antigen expression levels, and they are also the most frequently overlooked contributors to signal fluctuations. Common problem scenarios include:
- • Cell viability decline: Apoptotic or necrotic cells undergo epitope degradation and are prone to non-specific staining, leading to reduced positive signals and elevated background fluorescence.
- • Processing delays: Allowing fresh samples to sit too long or delaying staining post-processing can trigger antigen internalization or shedding from the cell surface, reducing signal intensity.
- • Fluctuations in expression levels: Primary cells isolated from different batches or cell lines under varying activation states possess inherent differences in target marker expression.
- • Inconsistent preservation: Storage at 4°C versus on ice, or using fresh versus cryopreserved/thawed samples, can significantly alter antigen expression and overall cell health.
Therefore, before attributing signal loss to reagents or instruments across different experimental batches, it is critical to ensure consistency in sample source, processing workflows, and storage conditions.
3. Instrument Status and Parameter Shifts
The optical detection system of a flow cytometer is the final output stage for signals; any instrument fluctuation directly impacts fluorescence intensity. Factors that can cause a global drop in signal include:
- • Laser degradation: Insufficient laser power leads to a global drop in excitation efficiency across all channels, manifesting as a systematic decrease in signal for all markers.
- • Channel sensitivity shifts: Optical misalignment or contaminated filters reduce light collection efficiency in specific channels.
- • PMT voltage adjustments: Photomultiplier tube (PMT) voltage shares a linear correlation with fluorescence signals. Even minor tweaks can cause a noticeable shift in the position of the positive population.
- • QC anomalies: Failure to perform daily quality control (QC) or instabilities in the PMT and fluidic systems can severely compromise signal reproducibility.
If multi-channel, multi-marker signal degradation occurs simultaneously, instrument status should be evaluated first by reviewing QC reports and calibration bead data.
4. Experimental Condition Variations
Minor procedural variations during staining can accumulate into stark discrepancies in the final data, a phenomenon particularly pronounced in multicolor flow panels. Common variables include:
- • Antibody titration and dilution: Over-diluting antibodies prevents full saturation of target markers, lowering the positive signal.
- • Incubation time and temperature: Insufficient incubation or low temperatures prevent the antigen-antibody binding from reaching equilibrium, yielding low signals. Conversely, over-incubation can elevate non-specific binding.
- • Washing conditions: Deviations in wash frequency, centrifugation speed, or buffer composition affect the removal of unbound antibodies, altering the signal-to-noise ratio.
- • Fixation/Permeabilization protocols: Excessive fixation times or high fixative concentrations can damage cell-surface epitopes, dimming membrane protein signals. Additionally, the choice of permeabilization buffer directly impacts intracellular staining efficiency.
II. How to Isolate the Specific Cause of Reduced Staining Signal?
Scenario 1: Simultaneous Signal Drop Across Multiple Markers
If signals drop uniformly across most or all channels within the same sample or panel, look for systemic factors rather than focusing on an individual antibody.
Recommended Troubleshooting Hierarchy:
- • Check Instrument Parameters & QC: Verify if PMT voltages and compensation matrices match historical baselines, and review recent QC and bead tracking data to rule out instrument drift.
- • Evaluate Sample Quality: Compare cell viability, sample source, and processing times against past successful experiments to identify discrepancies in sample state.
- • Audit the Staining Workflow: Confirm if incubation temperatures, times, buffer lots, or fixation conditions have been altered.
Simultaneous multi-marker signal abnormalities are rarely caused by performance issues with a single antibody. Blindly replacing antibodies will fail to resolve the issue and will only increase experimental costs.
Scenario 2: Signal Drop Confined to a Single Marker
If the staining signal and resolution of all other markers in the panel are normal, , and only one specific antibody shows a distinct signal drop, narrow your investigation to that reagent and its dedicated conditions.
Core Investigation Directions:
- • Review Usage Logs: Track when the vial was opened, its usage frequency, and storage location. Check for instances where it might have been left at room temperature too long, exposed to internal refrigerator lights, or accidentally frozen.
- • Inspect Physical Appearance: Check for visible precipitation, turbidity, or discoloration.
- • Verify Pipetting and Dilution: Confirm whether the dilution ratio and volume added match prior protocols, ruling out pipetting errors.
- • Parallel Control Validation: Perform a side-by-side comparison using a brand-new vial of the same catalog number under identical sample and experimental conditions. If the signal recovers, antibody degradation is confirmed.
Scenario 3: Decreased Positive Signal Paired with Elevated Non-Specific Background
This combined abnormality — decreased MFI of the positive population, along with tailing and elevated signal of the negative population, leading to reduced overall resolution — requires a two-pronged investigation.
Potential Causes:
- • At the antibody level: Mild aggregation of antibody proteins reduces the effective concentration available for specific binding while increasing non-specific binding, resulting in the dual effect of reduced signal and elevated background.
- • At the cellular level: Poor cell viability and excessive cellular debris cause antibodies to bind non-specifically to dead cells, elevating background fluorescence and masking true positive signals.
- • At the procedural level: Inadequate blocking, insufficient washing, or excessive antibody incubation time can simultaneously impair specific binding and increase non-specific background.
In this scenario, it is highly recommended to incorporate viability dyes and isotype controls to distinguish between antibody degradation, cell quality issues, or protocol errors.
III. Indicators for Evaluating Antibody Performance
Antibody degradation does not always manifest as visible precipitation or color shifts; it more commonly appears as a gradual deterioration of staining quality.
1. Continuous Decline in Positive Population MFI
With identical samples, instrument parameters, and experimental protocols, the MFI of the positive population for the same vial of antibody decreases progressively with repeated use, and this trend is stable across replicate experiments. Notably, for low-abundance markers, positive populations will gradually shift from clearly distinguishable to indistinguishable from the negative background, indicating a continuous decline in detection sensitivity.
2. Sustained Decrease in Resolution Between Positive and Negative Populations
The positive population exhibits poorly defined boundaries and severe tailing, leading to a dropping Stain Index (SI). Weakly positive cell populations merge with the negative background, forcing highly subjective gating and reducing overall data reliability.
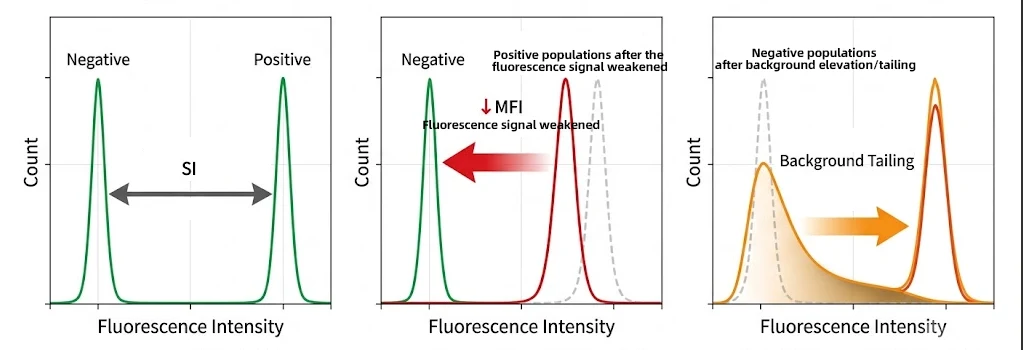
Figure 1. Abnormal flow cytometry results. (Left: Normal data; Middle: Left-shifted/weakened positive signal; Right: Tailing in the negative population).
3. Diminished Experimental Reproducibility
Using the same control sample and identical protocols, the run-to-run MFI variance increases significantly, with the coefficient of variation (CV) exceeding acceptable historical ranges. The same antibody performs erratically across different panels and days with no discernable pattern.
Note: These signs alone do not definitively confirm antibody failure. They must be evaluated comprehensively alongside storage logs, usage history, and control experiments.
IV. Key Factors Driving Antibody Performance Decline
The stability of a flow antibody hinges not only on manufacturing quality but tightly correlates with its handling throughout its lifecycle.
1. Improper Storage Conditions
Prolonged exposure to room temperature, repeated temperature fluctuations, or exposure to freezing or high temperatures during transportation can impair the stability of antibody protein structure, thereby altering antibody performance.
Flow cytometry antibodies should generally be stored at 2–8°C protected from light, and freezing is strictly prohibited. Accidental freezing or repeated thermal cycling directly damages protein structure, leading to quenching of protein-based fluorophores and breakage of conjugation bonds. The most intuitive manifestation is a continuous reduction in fluorescence signal intensity; protein aggregation may also be accompanied by elevated background fluorescence.
2. Prolonged, Repeated Handling
A single vial of antibody typically undergoes numerous openings and samplings over its lifespan. Frequent access increases exposure to temperature changes and introduces risks of microbial contamination or proteolytic degradation, accelerating performance decay.
3. Inherent Stability Variations Across Fluorophore
Different fluorophores possess distinct stability profiles. PE, APC, and their tandem dyes are macromolecular protein tags. They are fundamentally more vulnerable to temperature shifts, light exposure, and mechanical stress than small-molecule options like FITC or Alexa Fluor dyes. Tandem dyes are particularly susceptible to dissociation during long-term storage or handling, causing a drop in FRET efficiency. This not only dims the primary signal but can also introduce severe spillover into the donor channel (e.g., PE or APC channels), disrupting compensation matrices.
Note: This does not imply inferior quality for PE or APC antibodies; rather, it reflects the intrinsic physical properties of these fluorophores, which demand extra care during handling.
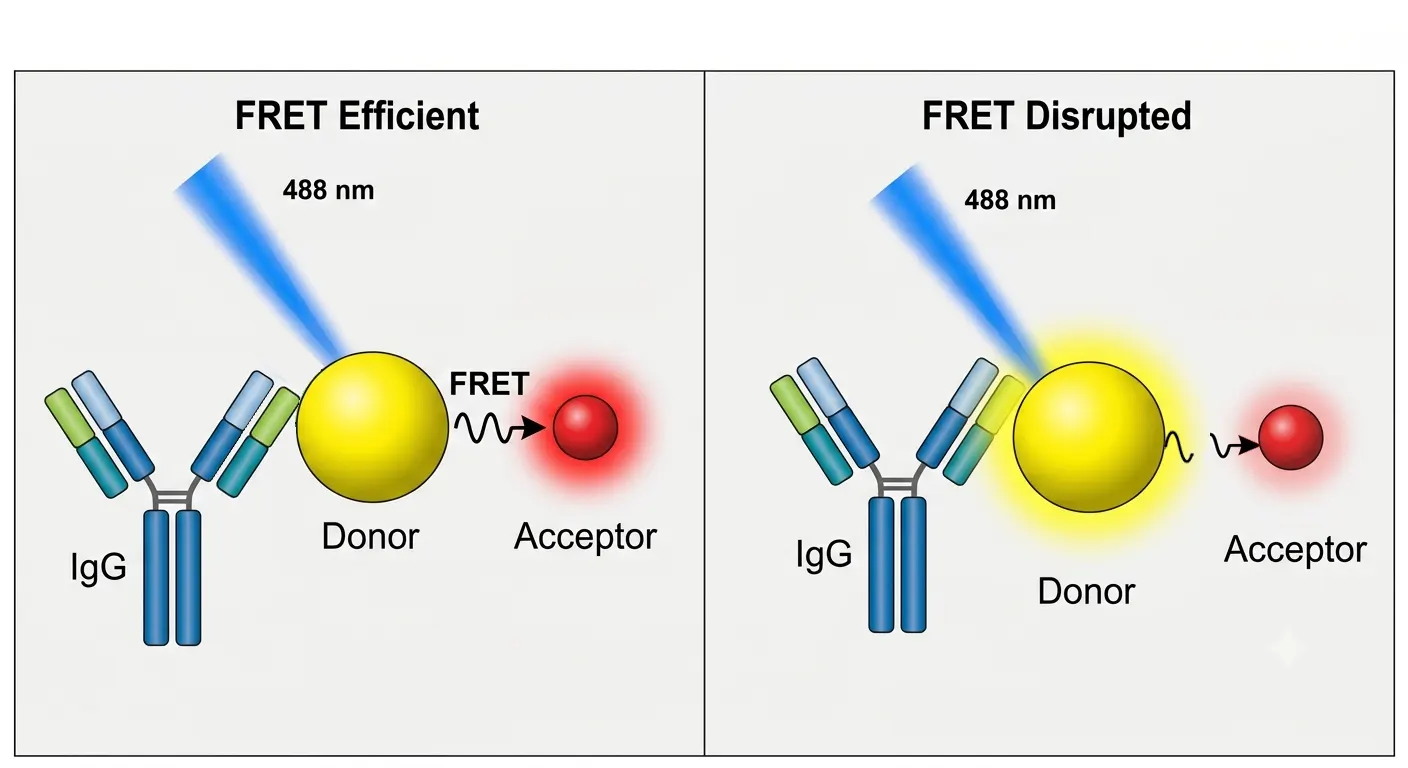
Figure 2. Dissociation of tandem dyes.
4. Approaching Expiration or Extended Storage
The expiration date listed on an antibody assumes strict adherence to recommended storage conditions. If handling is suboptimal, performance may decline well before the printed date. Therefore, the performance status of an antibody should be evaluated comprehensively by considering both the product expiration date and actual storage conditions, rather than judging antibody status solely by the date.。
V. Strategies to Mitigate the Impact of Antibody Performance Fluctuations
Standardized storage and handling protocols are fundamental to maintaining reproducible flow cytometry data. We recommend incorporating the following practices into your laboratory workflow:
- • Store antibodies strictly according to the product instructions; freezing and prolonged room temperature storage are strictly prohibited.
- • Return antibodies to their recommended storage conditions immediately after use to minimize thermal cycling.
- • If an antibody is used frequently, aliquot it into single-use volumes to minimize repeated opening and temperature fluctuations.
- • Mix gently before use; vigorous vortexing is not recommended.
- • Working dilutions should be prepared fresh immediately before use and are not suitable for long-term storage.
- • For critical or low-expression markers in long-term studies, run regular positive controls to track staining performance.
- • When staining quality shifts, systematically rule out sample, instrument, and procedural variables using control experiments before drawing conclusions about antibody degradation.
Summary
Different staining performance of the same vial of flow cytometry antibody at different usage stages does not necessarily mean the product has failed, nor can it be simply attributed to antibody quality issues.For researchers, it is more important to establish a systematic troubleshooting mindset: first confirm whether there are changes in samples, instruments, and experimental conditions, then comprehensively determine the source of the problem by combining the antibody’s storage records, usage history, and performance data.
Only on the basis of standardized storage, proper usage, and continuous attention to antibody performance can the stability and reproducibility of flow cytometry assay results be maximally ensured.
Looking for Reliable Flow Cytometry Antibodies to Support your Experimental Workflows?
abinScience Flow Cytometry Antibodies are subjected to rigorous quality control to ensure consistent fluorescent performance and clear discrimination of cell populations, supporting robust and reproducible flow cytometry analyses.
Learn More about abinScience Flow Cytometry Antibodies
About Us
abinScience was founded in 2023 as a strategic venture of AtaGenix (established 2011), dedicated to delivering premium life science reagents that accelerate discovery.
abinScience flow cytometry antibody products cover commonly used detection markers, with a wide variety to meet the research needs of multiple species(
Human,
Mouse,
Rat,
Dog,
Hamster,
Monkey, etc.)We provide stable and reliable support for scientific research.



 中文
中文 English
 한국어
한국어 日本語
日本語 Español
 Français
 Русский


