In our previous two articles in this series, Spectral VS Conventional Flow Cytometry: A Comparative Analysis of Compensation and Unmixing and Technical Value of Spectral Flow Cytometry: Which Conventional Flow Cytometry Bottlenecks Does It Solve?, we outlined the fundamental differences in detection principles between these two platforms. We also discussed how spectral flow cytometry specifically addresses the core pain points of conventional flow cytometry—namely, autofluorescence interference, resolution limitations imposed by spillover spreading error (SSE), complications from highly overlapping fluorochrome spectra, and the risks associated with tandem dye degradation.
Given that spectral flow cytometry delivers multicolor detection capabilities far superior to those of conventional flow cytometry, does this mean conventional flow cytometry has become an obsolete technology? Should all flow cytometry experiments migrate to spectral platforms? How should researchers choose between these two technologies?
The technological advantages of spectral flow cytometry does not equate to universal applicability across all research scenarios. For many routine studies, conventional flow cytometry remains an efficient and reliable choice, thanks to its mature methodologies, stable results, and lower operational costs; conversely, in specific research settings, the unique technical capabilities of spectral flow cytometry provide irreplaceable value. Rather than abstractly comparing the pros and cons of these two technologies, a more actionable criterion for evaluation is determining which technology best fits the specific scientific question and experimental setup.
Specifically, this "fit" can be broken down into two levels of evaluation: first, whether the technical advantages can actually be triggered, which depends on the type of scientific question, the panel design logic, and the sample's autofluorescence level; second, even if the trigger conditions are met, whether the return on investment aligns with the technical gains—which requires a clear understanding of the often-overlooked hidden costs of spectral flow cytometry.
1. Fundamental Assessment: Realizing Technical Advantages Depends on Trigger Conditions
Upon exposure to spectral flow cytometry, many researchers default to viewing it as a straightforward "technology upgrade." The assumption is that since it resolves so many pain points of conventional flow cytometry, choosing a spectral platform seems like the safer, more robust option if resources allow. However, in reality, every technical advantage of spectral flow cytometry relies on distinct trigger conditions. Whether your specific experiment will encounter these issues is the primary criterion for technology selection—if the problem itself does not exist, even the most powerful technical advantages become redundant.
In several common scenarios, the added value of spectral flow cytometry is limited. For instance, in a routine 6-color PBMC immunophenotyping assay (using CD3/CD4/CD8/CD19/CD56 combined with a viability dye), there is no significant spectral overlap among the selected fluorochromes, the sample itself has low autofluorescence, and tandem dyes are rarely used. In this case, data quality from conventional and spectral flow cytometry is virtually indistinguishable; however, conventional flow cytometry offers shorter workflows and lower consumable costs, making it the clearly superior choice. Conversely, if an experiment inherently struggles with severe fluorochrome spillover or autofluorescence masking true signals, spectral flow cytometry is well worth the investment.
Fundamentally, whether these "trigger conditions" are met depends on three key variables: the type of scientific question being addressed, the combinatorial logic of the fluorochromes within the panel, and the autofluorescence profile of the sample.
2. Type of Scientific Question: Differences in Information Density Between Exploratory and Confirmatory Studies
Experimental designs fundamentally entail two distinct types of information requirements. To some extent, this distinction dictates whether you need spectral flow cytometry long before you consider what instruments are currently available in the lab.
- • Exploratory studies typically demand extracting as much information as possible from the exact same pool of cells within a single tube—such as the co-expression data of multiple markers. Researchers need to know which markers are concurrently expressed on the same cell type, or which specific combination of markers defines an uncharacterized cell subpopulation. Once this single-cell level co-expression information is split into multiple smaller panels and mathematically reconstructed post-acquisition based on percentages, the definitive cell-to-cell correlations are lost—a deficiency that statistical methods cannot correct. For example, to unbiasedly profile the complete subpopulation architecture of T, B, NK cells, monocytes, and dendritic cells in PBMCs while simultaneously tracking their activation and functional states, it is often necessary to incorporate 20 or more markers into a single panel.
- • Confirmatory studies, by contrast, serve the opposite purpose: the markers are typically pre-determined by preliminary data or existing literature, and the experimental goal is to provide a statistically robust validation of a specific hypothesis. For instance, to verify whether a certain treatment upregulates activation markers like CD69 or CD25 on T cells, a combination of a few lineage markers and a viability dye is usually sufficient. A 4- to 8-color fluorochrome panel readily covers these requirements without the need to introduce additional dimensions into a single assay—which is precisely the fundamental reason why the 6-color PBMC assay mentioned in the previous section falls into the "limited value" category.
These varying information demands directly dictate whether panel design will face complex fluorochrome combinations and subsequent mutual interference.
3. Panel Design Logic: Fluorochrome Combinations, Not Color Counts, Dictate Technical Advantages
A common rule of thumb in the industry suggests that "spectral flow cytometry is recommended for panels exceeding 15 colors," which many treat as a rigid standard. However, the number of colors is merely a surface-level indicator. What truly determines your need for a spectral platform is the underlying combinatorial logic of the fluorochromes within the panel.
The magnitude of spillover spreading error (SSE) is never determined by the total number of colors alone; rather, it depends on the number of fluorochromes bleeding into a single detector, the degree of cross-spillover between those fluorochromes, and their intrinsic brightness. A poorly designed 10-color panel can easily perform worse on conventional flow cytometry than a well-optimized 15-color panel. The advantages of spectral flow cytometry do not suddenly materialize at a fixed color threshold; instead, its value becomes prominent when a panel presents any of the following scenarios:
- • Co-utilization of bright fluorochromes and low-expression (dim) markers, where spillover from a bright fluorochrome drastically compromises the resolution of the dim marker;
- • The need to simultaneously use multiple fluorochromes with highly overlapping emission spectra that are difficult to separate using conventional optical filter systems;
- • High-parameter panels where spreading error compromises the accurate population gating of weakly expressed populations.
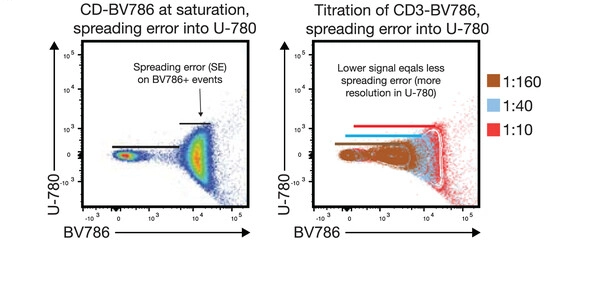
Figure 1. Resolution loss due to the co-utilization of bright fluorochromes and low-expression markers. The left plot shows a distinct spreading of the positive cell population, while the right plot demonstrates that the spreading error is directly proportional to signal intensity (Image source: DOI: 10.1002/eji.202170126).
For example, consider two different 8-color panels. If the targets are all highly expressed antigens like CD3 and CD4, paired with fluorochromes that have distinct spectral separation (e.g., FITC, PE, APC), the condition number of the compensation matrix on conventional flow cytometry will be excellent (a better condition number signifies a more stable compensation matrix and minimal mathematical calculation error), yielding clear and reliable population resolution. However, if your 8-color panel requires pairing a bright fluorochrome like PE with a lowly expressed marker, while simultaneously utilizing spectrally adjacent dyes like PE-Cy7 and APC-Cy7, compensation adjustment on conventional flow cytometry becomes challenging. Spillover from the bright fluorochromes will degrade the signal of the dim marker. Transitioning to spectral flow cytometry in this scenario provides a notable boost in resolution.
Even when designing an ultra-high-parameter 40-color panel, the core strategy revolves around systematically evaluating the interplay between fluorochrome brightness, antigen expression levels, and spectral similarity—not simply stacking color counts. The number of colors is the outcome of meticulous panel design, not the premise for choosing a technological platform.
4. Sample Type: Autofluorescence Levels Dictate the Realization of Technical Gains
If panel design dictates whether spectral flow cytometry can deliver an advantage, the sample type determines how substantial that advantage will be. The most critical variable here is autofluorescence (AF).

Figure 2. Impact of autofluorescence on experimental results. Left: autofluorescence removed (unmixed); Right: autofluorescence not removed (Image source: DOI: 10.3389/fbioe.2022.827987).
One of the most irreplaceable values of spectral flow cytometry is its capacity to handle highly autofluorescent samples, but this value is realized only if the sample inherently exhibits intense, heterogeneous autofluorescence backgrounds. For samples with minimal autofluorescence, such as fresh PBMCs or suspension cell lines, spectral flow cytometry's autofluorescence extraction feature remains largely redundant, and results between the two platforms will not differ substantially. Based on the characteristics of autofluorescence, the following sample types typically benefit the most from a spectral approach:
- • Solid Tissue Digests: Cells derived from solid tissues not only exhibit high-intensity autofluorescence but also display vast differences in spectral signatures across various cell types, making them one of the most challenging scenarios for conventional flow cytometry. In digested samples from tumors, liver, or lung tissue, autofluorescence overlaps with multiple fluorescence channels, severely compromising population gating; spectral flow cytometry can treat autofluorescence as an independent parameter and unmix it, markedly improving resolution.
- • Fixed Samples: Fixation alters the autofluorescence profile of cells, universally elevating background noise. Furthermore, variations in fixation duration and fixative formulations can shift autofluorescence spectral characteristics, making uniform correction difficult in conventional flow cytometry. Spectral flow cytometry can extract a dedicated autofluorescence spectrum from fixed controls, effectively suppressing background noise.
- • Macrophage-Rich Samples: Macrophages are among the most autofluorescent immune cell types, and their autofluorescence intensity and spectra vary depending on their functional and activation states (e.g., Kupffer cells, tumor-associated macrophages). On conventional platforms, autofluorescence often precludes accurate subpopulation resolution; spectral flow cytometry can not only subtract this interference but can even utilize autofluorescence itself as a gating parameter to differentiate subpopulations with varying phagocytic capacities.
- • High-Background Organs/Tissues: For instance, murine lung tissue naturally contains multiple distinct autofluorescent spectra. Conventional flow cytometry cannot differentiate or subtract these individually, whereas spectral flow cytometry can targetedly unmix each unique signature.
The core logic for assessment is straightforward: Has autofluorescence substantially impaired the resolution of your target cell populations? If yes, the advantages of spectral flow cytometry will shine; if not, the difference between the two platforms may be negligible.
5. Evaluating Hidden Costs: Matching Methodological Investment with Technical Gains
While the scientific question, panel design logic, and sample autofluorescence determine whether the advantages of spectral flow cytometry can be triggered, meeting these conditions does not automatically guarantee a favorable return on investment—this brings us to the evaluation of hidden costs. When discussing this, costs are unavoidable. Most researchers focus on explicit expenses like instrument procurement, reagents, and consumables; however, the most frequently underestimated expenses in spectral flow cytometry are the hidden methodological costs—these do not appear on a quotation sheet but will consume significant experimental time and labor.
Chief among these is the strict accuracy threshold required for single-stain controls. Unlike conventional compensation controls, single-stain controls for spectral unmixing demand rigorous quality standards and are highly sensitive to reagent lots, cell types, and instrument status. This is widely recognized as one of the most labor-intensive steps in spectral workflows. For example, tandem dyes must originate from the exact same lot and cannot be prepared in bulk for long-term use—different tandem dyes exhibit highly variable photodegradation rates; once degraded, their spectral signatures shift, directly compromising unmixing accuracy and requiring frequent re-verification.
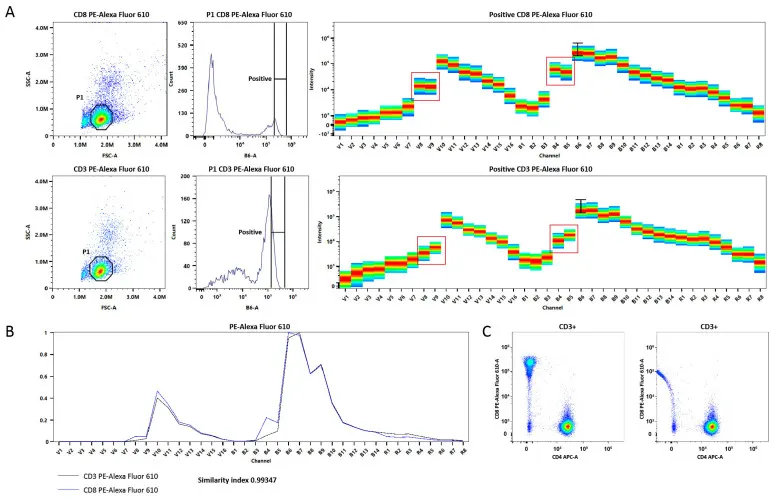
Figure 3. Spectral unmixing errors caused by utilizing different lots of tandem dyes (Image source: DOI: 10.3390/ijms26125911).
Second is the shift in the data analysis bottleneck. Many assume that because spectral flow cytometry eliminates manual compensation adjustments, the operation is inherently simpler. In reality, it merely shifts the burden from compensation tuning to rigorous quality control of spectral unmixing: evaluating whether fitting residuals are acceptable, identifying unmixing artifacts, and troubleshooting control irregularities all require an entirely new conceptual framework. Experience with conventional flow cytometry cannot be directly transferred or applied here; the learning curve for a research team represents a continuous, rather than a one-time, investment.
Furthermore, full-spectrum data files are substantially larger, requiring more intensive preprocessing steps for downstream high-dimensional analysis. Data cleaning, batch correction, and scaling transformations scale exponentially in large-scale screening experiments. If novel fluorochromes or custom-conjugated antibodies are used, they may not be covered by commercial spectral libraries, forcing researchers to generate and validate reference spectra from scratch, which further inflates the upfront workload. These costs are not insurmountable, but they must align with the technical payoffs of the experiment. If the objective is merely a short-term, low-parameter confirmatory assay, these hidden methodological costs will heavily outweigh the benefits provided by a spectral platform.
Conclusion
Spectral flow cytometry addresses a highly specific set of real technical challenges, but these challenges do not present themselves in every flow cytometry experiment—it is not a blanket upgrade or a direct replacement for conventional flow cytometry; rather, it is a specialized solution tailored to specific pain points.
The core of technology selection is never about chasing the most cutting-edge tools or abstractly debating which platform is more advanced. Instead, it requires satisfying two criteria simultaneously: first, whether the technical advantage is actually triggered (dictated by the scientific question, panel design logic, and sample autofluorescence level); second, whether the hidden costs align with the technical returns once triggered. Only when both conditions are met does choosing a spectral platform become truly justifiable; if only one condition is satisfied, conventional flow cytometry remains the more prudent and reliable choice.
Looking for Reliable Flow Cytometry Antibodies to Support your Experimental Workflows?
abinScience Flow Cytometry Antibodies are subjected to rigorous quality control to ensure consistent fluorescent performance and clear discrimination of cell populations, supporting robust and reproducible flow cytometry analyses.
Learn More about abinScience Flow Cytometry Antibodies
About Us
abinScience was founded in 2023 as a strategic venture of AtaGenix (established 2011), dedicated to delivering premium life science reagents that accelerate discovery.
abinScience flow cytometry antibody products cover commonly used detection markers, with a wide variety to meet the research needs of multiple species(
Human,
Mouse,
Rat,
Dog,
Hamster,
Monkey, etc.)We provide stable and reliable support for scientific research.

Reference:
- [1] Wanner, N., Barnhart, J., Apostolakis, N., Zlojutro, V., & Asosingh, K. (2022). Using the Autofluorescence Finder on the Sony ID7000TM Spectral Cell Analyzer to Identify and Unmix Multiple Highly Autofluorescent Murine Lung Populations. Frontiers in bioengineering and biotechnology, 10, 827987. https://doi.org/10.3389/fbioe.2022.827987
- [2] Cossarizza, A., Chang, H. D., Radbruch, A., Abrignani, S., Addo, R., Akdis, M., Andrä, I., Andreata, F., Annunziato, F., Arranz, E., Bacher, P., Bari, S., Barnaba, V., Barros-Martins, J., Baumjohann, D., Beccaria, C. G., Bernardo, D., Boardman, D. A., Borger, J., Böttcher, C., … Yang, J. (2021). Guidelines for the use of flow cytometry and cell sorting in immunological studies (third edition). European journal of immunology, 51(12), 2708–3145. https://doi.org/10.1002/eji.202170126
- [3] Bourdely, P., Petti, L., Khou, S., Meghraoui-Kheddar, A., Elaldi, R., Cazareth, J., Mossadegh-Keller, N., Boyer, J., Sieweke, M. H., Poissonnet, G., Sudaka, A., Braud, V. M., & Anjuère, F. (2022). Autofluorescence identifies highly phagocytic tissue-resident macrophages in mouse and human skin and cutaneous squamous cell carcinoma. Frontiers in immunology, 13, 903069. https://doi.org/10.3389/fimmu.2022.903069
- [4] Astakhova, E. A., Gubaeva, A. S., Naumova, D. A., Egorova, A. E., Maznina, A. A., Rybkina, I. G., Osmanov, I. M., Tabakov, D. V., Mityaeva, O. N., & Volchkov, P. Y. (2025). Spectral Flow Cytometry: The Current State and Future of the Technology. International journal of molecular sciences, 26(12), 5911. https://doi.org/10.3390/ijms26125911

 中文
中文 English
 한국어
한국어 日本語
日本語 Español
 Français
 Русский


