In our previous article, we discussed the core conceptual difference between spectral and conventional flow cytometry: while conventional flow cytometry relies on a compensation matrix to subtract spillover signals channel by channel, spectral flow cytometry captures the full emission spectrum of every single cell and utilizes spectral unmixing to simultaneously isolate the contributions of all fluorochromes.With the principles established, a more practical question naturally arises: how do these technical differences address common challenges in routine flow cytometry workflows?
1. Autofluorescence: A Standout Application for Spectral Flow Cytometry
In flow cytometry, autofluorescence (AF) is arguably one of the most frustrating hurdles for operators. It manifests as background noise inherent to every cell, reducing the signal-to-noise ratio (SNR) and compromising the resolution of dim positive populations. Furthermore, it is virtually impossible to truly eliminate using conventional methods.。
Why Conventional Compensation Fails with Autofluorescence
For conventional compensation to function properly, there is a fundamental prerequisite: the source of the spillover signal must be a known, defined fluorochrome. Establishing a compensation matrix relies on single-stain controls for each fluorochrome—knowing exactly how much FITC spills into the PE channel allows you to set a coefficient to subtract it.
Autofluorescence completely violates this premise. Cellular AF is a complex, blended emission from various endogenous biomolecules, including NADH, FAD, lipofuscin, and collagen, which do not match the spectral profile of any single known fluorochrome. Consequently, it is impossible to set up an "autofluorescence single-stain control" to integrate into a standard compensation matrix.
Compounding this issue, AF intensity can vary by several-fold—or an order of magnitude—between different cell types. Macrophages exhibit some of the highest AF levels among immune cells, with an emission spectrum that spans almost the entire visible light range, whereas lymphocytes display relatively low AF. When both cell types coexist in a single sample tube, conventional flow cytometry lacks the tools to selectively address this heterogeneous background.
A previous study reported a subpopulation of Foxp3-positive macrophages in mouse bone marrow, spleen, liver, lymph nodes, and thymus. However, subsequent research revealed that a portion of the signal originally interpreted as Foxp3-positive was actually artifacts driven by a high autofluorescence background. This case highlights that in highly autofluorescent tissues, AF not only reduces resolution but can also confound data interpretation.
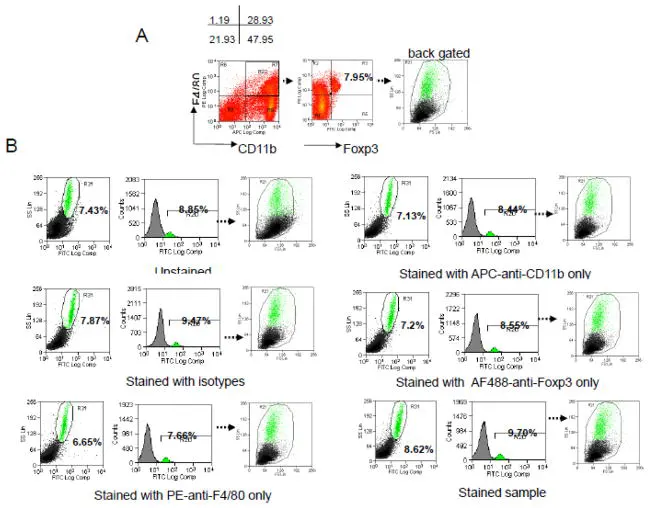
Figure 1. Foxp3+ signals in mouse bone marrow macrophages. Back-gating revealed that the positive signals overlapped with the autofluorescent cell population (Source: DOI: 10.1016/j.jim.2012.08.014).
The Spectral Flow Cytometry Approach
The unmixing framework of spectral flow cytometry does not require every signal source to be an exogenous fluorochrome. The autofluorescence spectrum of an unstained cell can be treated as an independent "component" within the unmixing algorithm. This allows the software to extract the autofluorescent signature concurrently while resolving individual fluorochrome contributions.
Mathematically, this process is identical to resolving any other fluorochrome, yet the outcome is profoundly different: autofluorescence is no longer passively accepted as background noise. Instead, it is treated as a distinct spectral parameter that can be isolated and factored into downstream analysis.
This capability is particularly invaluable when processing complex biological samples. Immune cells derived from the liver, infiltrating cells from the intestinal lamina propria, and bronchoalveolar lavage fluid (BALF) all present highly divergent AF signatures across cell populations. Moreover, these profiles change dynamically under pathological conditions such as inflammation or fibrosis. Spectral flow cytometry can identify and individually extract multiple distinct AF signatures within the same sample, rather than performing a crude, uniform background subtraction.
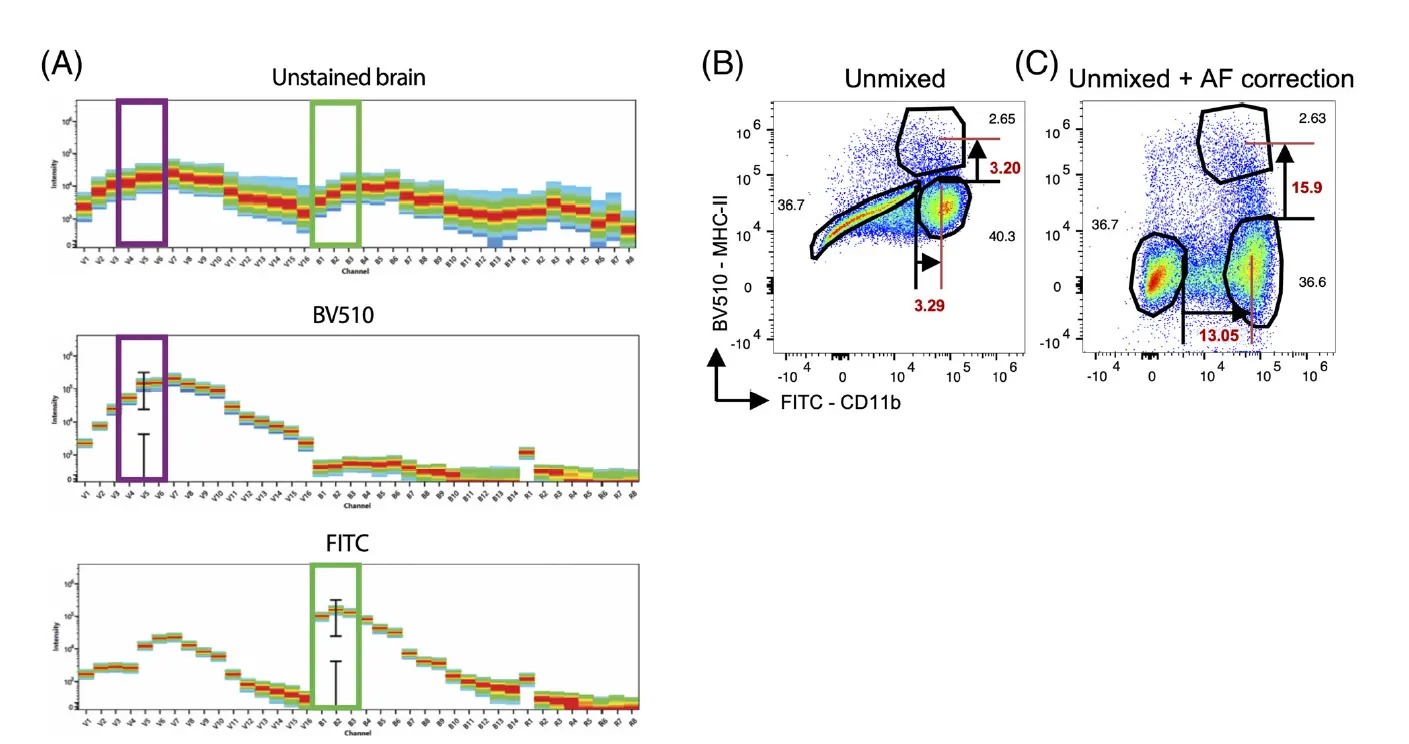
Figure 2. Differentiation of autofluorescence signatures using spectral flow cytometry (Source: DOI: 10.1002/cyto.a.24211).
2. The "Silent Failure" of Tandem Fluorochromes: A Widely Overlooked Risk to Data Quality
Among all the bottlenecks solved by spectral flow technology, this issue is rarely highlighted in vendor brochures, yet its impact on experimental data quality is widespread.
How Tandem Fluorochromes "Silently" Degrade
Tandem fluorochromes like PE-Cy7, APC-Cy7, and BV786 operate on the principle of Förster Resonance Energy Transfer (FRET): a donor fluorochrome (such as PE or BV) absorbs the excitation light and transfers this energy to an acceptor fluorochrome (such as Cy7), which then emits light at a longer wavelength. This energy transfer is not permanently stable under experimental conditions; exposure to light, temperature fluctuations, and repeated freeze-thaw cycles can cause the coupling efficiency between the donor and acceptor to deteriorate—a phenomenon known as uncoupling.
Quantitative data also indicates that the degradation rate of tandem fluorochromes like APC-Cy7 is strongly cell-type-dependent. Within the exact same sample tube, the degree of tandem fluorochrome degradation on monocytes can be significantly higher than on lymphocytes.
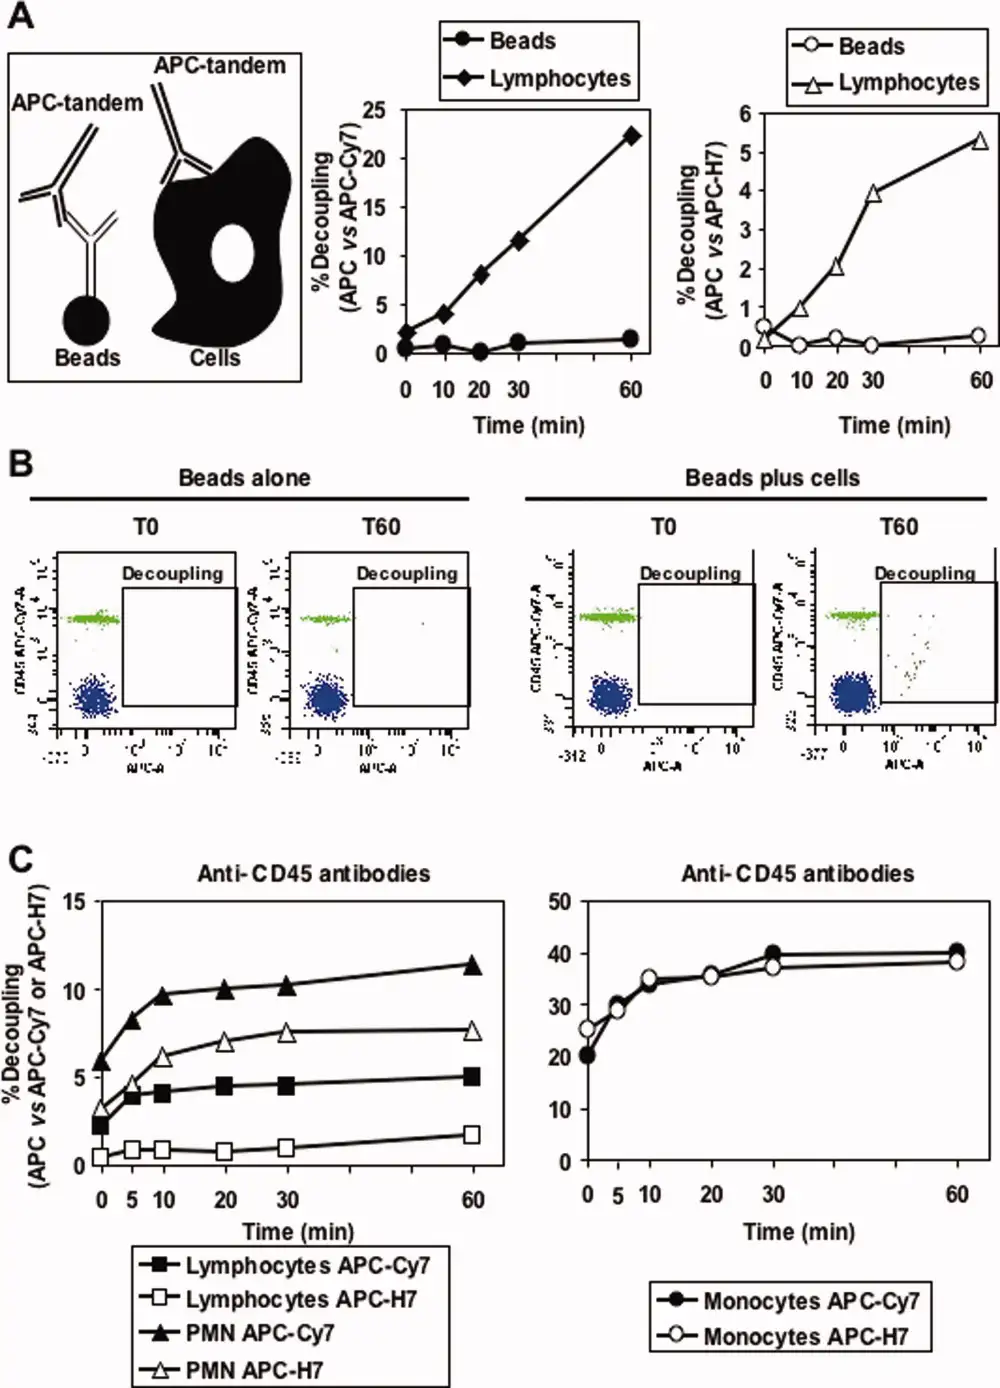
Figure 3. Uncoupling mechanisms of tandem fluorochromes (Source: DOI: 10.1002/cyto.a.20774).
Once uncoupling occurs, energy that should have been emitted by the acceptor is instead emitted by the donor at its own native wavelength. For PE-Cy7, this means an unexpected signal increase appears in the PE channel (~575 nm), accompanied by a signal drop in the Cy7 channel (~785 nm).
Why Conventional Flow Cytometry Fails to Detect This
Conventional flow detectors only register the total integrated signal within their specific bandpass filter range. When PE-Cy7 uncouples and the PE channel signal spikes, the operator perceives this simply as "PE-Cy7 bleeding heavily into the PE channel." The intuitive response is to assume a compensation issue and manually increase the compensation coefficient.
Adjusting the compensation forces the data to look visually "correct" on a plot—but this visual correction is achieved using erroneous compensation settings. The actual biological signal carried by PE-Cy7 has already been partially distorted, and the degradation of the tandem fluorochrome itself is masked by the compensation adjustment. No error is triggered by the instrument, the FCS file remains structurally intact, and the data appears uncompromised at first glance.
This is the essence of a "silent failure": errors are not flagged by the system and remain in the dataset while appearing normal. For longitudinal cohorts or multi-center collaborations, varying degrees of tandem fluorochrome degradation across batches—combined with compensation settings that systematically mask these differences—can compromise inter-batch data comparability, often leaving researchers entirely unaware.
Spectral Flow Shifts Problems from "Invisible" to "Visible"
Spectral flow cytometry captures the full emission spectrum of every cell. The full spectral signature of intact PE-Cy7 is distinctly different from its uncoupled state: intact fluorochromes peak primarily at 785 nm via Cy7, whereas uncoupled fluorochromes exhibit an additional donor emission peak around 578 nm from PE.
When a reference spectrum from an intact PE-Cy7 control is used to fit a sample containing partially uncoupled fluorochromes, the unmixing residuals (goodness-of-fit errors) increase. This metric can be quantitatively monitored, serving as a flag that the reference spectrum does not match the actual status of the tandem fluorochrome in the sample.
While spectral flow cytometry cannot repair a degraded tandem fluorochrome, it successfully converts an "invisible error" into a "detectable anomaly." Rather than preventing degradation, it provides the tools to track and evaluate variances that would otherwise be buried within a compensation matrix. This represents a substantial advancement in experimental quality control, offering immense value for long-term longitudinal studies and multi-center trials.
3. Spillover Spreading Error: A Long-Underestimated Mathematical Bottleneck
If autofluorescence is a palpable pain point during flow operations, spillover spreading error (SSE) is a more insidious limitation. It does not trigger obvious error flags, yet it quietly imposes an upper limit on the data quality.
The logic behind conventional compensation is straightforward: subtract the proportion of signal spilling from other fluorochromes into the target channel. Intuitively, removing this interference should yield cleaner data.
However, the physics of error propagation complicates this. The spillover signal being subtracted is not an absolute, static integer; it is an estimate bound by measurement error and photon statistics. When two values with inherent measurement uncertainty are subtracted, the uncertainty of the outcome does not decrease—it compounds. This is a fundamental law of error propagation that no mathematical manipulation can circumvent.Mario Roederer systematically described and defined this phenomenon in 2001: following compensation, the population distribution within the compensated channel widens (spreads). The magnitude of this spread is directly proportional to the square root of the brightness of the spilling fluorochrome. The brighter the fluorochrome, the more severe the post-compensation spreading error.
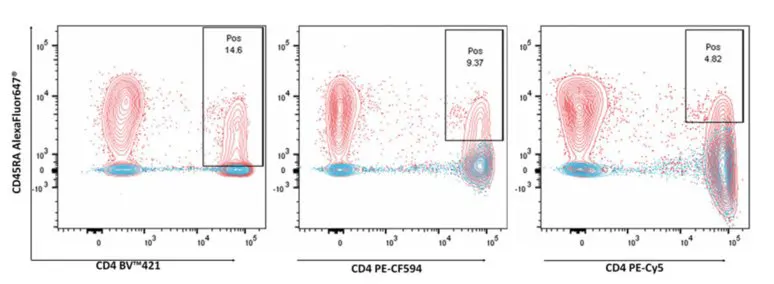
Figure 4. Visualization of Spreading Error.
To put this into a laboratory perspective: in a high-parameter panel containing a bright PE conjugate, the negative population in channels adjacent to PE will appear broadened, even if the compensation mean is perfectly accurate. If you are trying to resolve a dim, weakly positive population in those adjacent channels, it can become entirely swallowed by the widened negative population.
This loss of resolution is not a reflection of poor instrument sensitivity or flawed operator technique—it is a mathematical resolution limit imposed by the compensation process itself. As the number of fluorochromes increases, multi-directional spreading errors compound exponentially. This is precisely why designing panels exceeding 20 colors in conventional flow cytometry becomes exceptionally challenging; every added fluorochrome requires a careful cost-benefit analysis regarding the spreading error it inflicts on neighboring channels.
How Spectral Unmixing Moderates Error Propagation
Spectral unmixing uses least-squares regression to simultaneously solve for all fluorochrome contributions across the entire spectral continuum, rather than relying on sequential, channel-by-channel subtractions. This global optimization process alters how errors propagate compared to conventional subtractive compensation.
To be mathematically accurate, spectral unmixing is not entirely immune to variance propagation. When two fluorochromes share highly similar full-spectrum profiles (high collinearity), unmixing can still introduce numerical instability. However, its architectural framework provides a more robust mathematical foundation for handling multi-component, high-parameter assays. Consequently, spectral flow cytometry preserves population resolution more effectively in complex panels. That said, antigen detection sensitivity remains simultaneously governed by multiple variables, including fluorochrome brightness, instrument performance, and overall panel design.
4. Resolving Spectrally Close Fluorochromes: A Paradigm Shift in Panel Design
This advantage is frequently described as "spectral flow allows for more colors." While true, this phrasing obscures a more profound benefit: spectral flow cytometry completely redefines the starting logic of panel design.
Conventional panel design has long adhered to a strict rule: fluorochromes with overlapping emission peaks excited by the same laser cannot be used together. For example, FITC (519 nm) and BB515 (515 nm) are incompatible, and PE (578 nm) can rarely coexist with mCherry (610 nm). This constraint is an unavoidable byproduct of conventional bandpass filter systems, where overlapping emission profiles cannot be uncoupled by standard compensation.
Spectral flow cytometry resolves fluorochromes by analyzing their full spectral signatures rather than evaluating isolated, single-point bandwidths. Even if two fluorochromes share nearly identical emission peaks, unmixing can separate them provided there are distinct variances across their overall spectral shapes. Peer-reviewed studies have demonstrated that fluorochrome pairs once deemed entirely incompatible in conventional setups—such as Qdot 705 and BV711, or V450 and BV421—can be run concurrently and successfully resolved using spectral platforms.
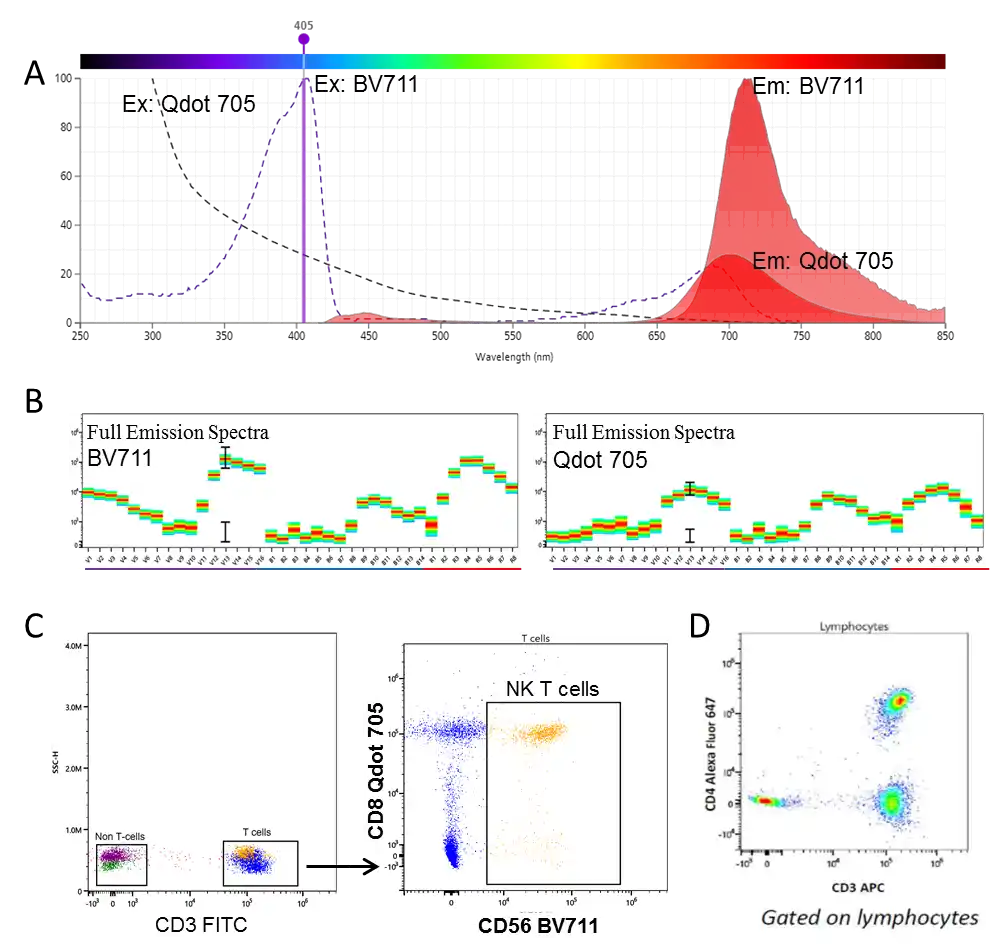
Figure 5. (A) Highly overlapping emission spectra of Qdot 705 and BV711. (B) Full spectral signatures of both fluorochromes. (C) Co-expression resolution of CD8 and CD56 using Qdot 705 and BV711. (D) Co-indexing performance of APC and Alexa Fluor 647 in a spectral panel.
For researchers, this translates to a fundamental shift in strategy. Conventional panel design often forced compromises: to target a low-abundance antigen, you might select a highly intense fluorochrome, only to realize its emission profile sits too close to an existing fluorochrome in your panel. Forcing a swap to a dimmer fluorochrome directly compromises the resolution of that dim target population. Such upstream design compromises cascade through the entire workflow, ultimately capping the quality of the final dataset.
Spectral flow significantly reduces the need for these compromises. Panel design can prioritize biological requirements—allocating the brightest fluorochromes to the weakest markers first—rather than constantly maneuvering around optical constraints and settling for suboptimal remaining choices.
5. Data Reproducibility: A Critical Long-Term Objective
While standardized methodologies exist for conventional flow compensation (such as utilizing antibody-capture beads and aligning positive/negative peaks), the actual execution frequently introduces operator subjectivity, particularly during manual post-compensation adjustments. Subtle, cumulative variances inevitably creep into compensation matrices adjusted by different operators, on different days, or across distinct reagent lots.
While these discrepancies might remain imperceptible within a single experimental run, they pose a significant threat to data comparability across longitudinal cohorts or multi-center networks. Real-world multi-center studies demonstrate that harmonizing flow cytometry data across disparate instruments and institutions is a major technical challenge, typically demanding extensive and costly standardization protocols to mitigate.
Conversely, spectral unmixing relies on reference controls that document the complete emission characteristics of a fluorochrome under current instrument configurations. These reference spectra can be precisely quantified, digitally archived, and compared across experimental runs. Assuming instrument stability, reference spectra display high reproducibility; any optical or fluidic drift can be flagged quantitatively. This establishes a highly objective foundation for quality control compared to subjective compensation adjustments.
Furthermore, provided that instrument configurations are fully matched, sharing reference spectral libraries across distinct laboratories is theoretically achievable, thereby reducing inter-site systemic variance. Researchers have increasingly advocated for archiving spectral panel specifications in open, shared databases to drive methodological standardization across the field.
Conclusion
While the challenges outlined above appear distinct, they stem from a singular root limitation: conventional flow cytometry relies predominantly on fluorescence intensity values captured across a limited set of discrete detection channels, whereas spectral flow cytometry leverages the full information content of the emission spectrum. This expansion in data dimensionality does not alter the underlying physics of fluorescence; rather, it provides investigators with advanced mathematical tools to deconvolve complex signals.
From isolating autofluorescence to managing spreading errors, and from resolving closely matching fluorochromes to flagging tandem fluorochrome degradation, the core innovation of spectral flow cytometry lies not merely in expanding the color count, but in fundamentally changing how signals are resolved. Evaluating spectral technology solely by its capacity to run larger panels overlooks its most impactful contributions to data integrity.
Naturally, spectral flow cytometry introduces its own technical trade-offs. The accuracy of spectral unmixing is far more dependent on the quality of reference controls than conventional setups are on single-stained controls; a flawed reference spectrum will impact the resolution of the entire panel rather than being confined to a single channel.
Balancing these trade-offs—and determining when to deploy spectral workflows versus when conventional flow remains the more efficient choice—will be the focus of the third article in this series.
Looking for Reliable Flow Cytometry Antibodies to Support your Experimental Workflows?
abinScience Flow Cytometry Antibodies are subjected to rigorous quality control to ensure consistent fluorescent performance and clear discrimination of cell populations, supporting robust and reproducible flow cytometry analyses.
Learn More about abinScience Flow Cytometry Antibodies
About Us
abinScience was founded in 2023 as a strategic venture of AtaGenix (established 2011), dedicated to delivering premium life science reagents that accelerate discovery.
abinScience flow cytometry antibody products cover commonly used detection markers, with a wide variety to meet the research needs of multiple species(
Human,
Mouse,
Rat,
Dog,
Hamster,
Monkey, etc.)We provide stable and reliable support for scientific research.

Reference:
- [1] Roederer M. Spectral compensation for flow cytometry: visualization artifacts, limitations, and caveats. Cytometry. 2001;45(3):194-205.
- [2] Daemen S, et al. Managing Autofluorescence in Spectral Flow Cytometry for Macrophage Identification in the Liver. European Journal of Immunology. 2026. doi: 10.1002/eji.70217.
- [3] Schaefer PM, et al. NADH Autofluorescence—A Marker on its Way to Boost Bioenergetic Research. Cytometry Part A. 2019;95(1):34-46.
- [4] Abir AH, Weckwerth L, Wilhelm A, et al. Metabolic profiling of single cells by exploiting NADH and FAD fluorescence via flow cytometry. Molecular Metabolism. 2024;87:101981.
- [5] Bertolo A, Baur M, Guerrero J, Pötzel T, Stoyanov J. Autofluorescence is a Reliable in vitro Marker of Cellular Senescence in Human Mesenchymal Stromal Cells. Scientific Reports. 2019;9(1):2074.
- [6] Roederer M. Spectral compensation for flow cytometry: visualization artifacts, limitations, and caveats. Cytometry. 2001;45(3):194-205.
- [7] Schmutz S, Valente M, Cumano A, Novault S. Spectral Cytometry Has Unique Properties Allowing Multicolor Analysis of Cell Suspensions Isolated from Solid Tissues. PLoS ONE. 2016;11(8):e0159961.
- [8] Hulspas R, O'Gorman MRG, Wood BL, Gratama JW, Sutherland DR. Flow cytometry and the stability of phycoerythrin-tandem dye conjugates. Cytometry Part A. 2009;75(12):1002-1009.
- [9] Le Roy C, Varin-Blank N, Ajchenbaum-Cymbalista F, Letestu R. Flow cytometry APC-tandem dyes are degraded through a cell-dependent mechanism. Cytometry Part A. 2009;75(10):882-888.
- [10] Le Lann L, Jouve PE, Alarcón-Riquelme M, et al. Standardization procedure for flow cytometry data harmonization in prospective multicenter studies. Scientific Reports. 2020;10(1):11567.
- [11] Cosma A, Quintana-Murci L, Holtmann H, et al. A practitioner's view of spectral flow cytometry. Nature Methods. 2024;21(5):740-743.
- [12] Li, F., Yang, M., Wang, L., Williamson, I., Tian, F., Qin, M., Shah, P. K., & Sharifi, B. G. (2012). Autofluorescence contributes to false-positive intracellular Foxp3 staining in macrophages: a lesson learned from flow cytometry. Journal of immunological methods, 386(1-2), 101–107.

 中文
中文 English
 한국어
한국어 日本語
日本語 Español
 Français
 Русский


