An unexpected increase in the percentage of positive cells in flow cytometry does not automatically reflect a true upregulation of target antigen expression. Whether a marker shifts from 20% to 50% positive or a distinct negative population develops an unexpectedly broad "positive" tail, biological expression changes are only one potential cause. The "positive" population reported by a flow cytometer is not an intrinsic biological label; it is a composite metric generated through antibody binding specificity, fluorophore excitation and emission, signal conversion, optical compensation, and user-defined gating. When positive rates rise abnormally, troubleshooting requires a systematic evaluation of biological expression, background noise, antibody staining, fluorophore spillover, and data analysis standards.
1. Differentiating Signal Intensity Increase from Threshold Expansion
A "positive" result in flow cytometry is not an absolute state independent of analysis. An event is classified as positive based on its fluorescence intensity relative to background noise and the defined gating boundary. Consequently, an increase in positivity from 20% to 50% can stem from two entirely different mechanisms: a genuine increase in the fluorescence intensity of target-expressing cells, or a rightward shift of the negative background population that pushes more events across the positive threshold. Although both scenarios yield higher positive percentages, they require distinct troubleshooting approaches.
Rightward shift of the positive population (enhanced signal intensity)
If the positive population retains its original gating shape while shifting toward higher fluorescence intensities, the change suggests increased target antigen expression, higher antibody binding, or instrument setting adjustments. In such cases, the rise in positive percentage often occurs because an overall signal shift pushes events past a fixed threshold. Researchers should evaluate Median Fluorescence Intensity (MFI) alongside positivity percentages and verify whether antibody clones, fluorophore conjugates, or cytometer acquisition settings have changed.
Rightward shift of the negative population (elevated background)
If the negative population shifts toward higher fluorescence, the increased positive percentage cannot be attributed to antigen upregulation. High background fluorescence—caused by cellular autofluorescence, non-specific antibody binding, or uncompensated spectral spillover—forces negative events across the original positive gate boundary.
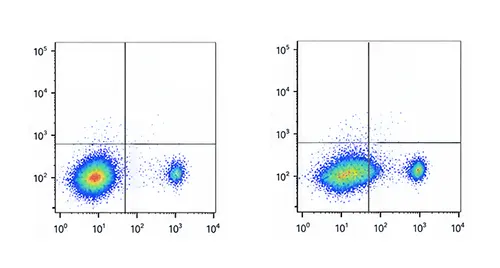
Figure 1: High positive rates caused by rightward shift of the negative population
2. Antibody and Staining Variables: Over-Titration and Non-Specific Binding
Antibody excess
Titrating an antibody under fixed conditions typically yields an initial rapid increase in positive signal intensity until reaching a saturation plateau. Adding antibody beyond this saturation point causes background fluorescence to rise continuously without improving target signal. This degrades the Signal-to-Noise Ratio (SNR) and resolution, artificially inflating the positive percentage. To investigate excessive antibody concentration, compare current staining patterns with historical titration curves or re-titrate to evaluate positive and negative population resolution across concentrations.
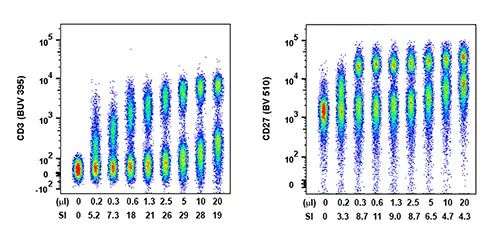
Figure 2: Excessive antibody concentration increases background noise and reduces population resolution [DOI: 10.1002/cyto.a.22808]
Clone specificity and binding affinity
Different antibody clones targeting the same marker recognize distinct epitopes and exhibit unique binding affinities and background profiles. Switching clones—even while keeping the target antigen constant—frequently leads to variations in positive percentage, MFI, and background intensity. Any change in antibody product or clone number must be evaluated as an independent experimental variable rather than assuming biological variance.
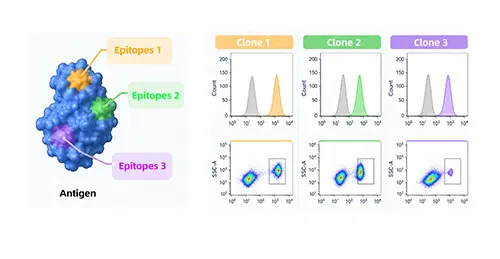
Figure 3: Discrepancies in staining profiles across antibody clones
Non-specific binding
Antibodies can bind non-specifically via Fc receptors (FcR) or electrostatic/hydrophobic interactions rather than antigen-specific Fab-mediated binding. Cell types with high FcR expression (e.g., monocytes, macrophages, and dendritic cells) are particularly susceptible to Fc-mediated background noise. When an unexpected positive rate or elevated background across multiple markers occurs simultaneously on a specific cell subpopulation, assess whether non-specific binding or insufficient FcR blocking is responsible.
3. Background Fluorescence: Autofluorescence and Dead Cell Interference
Background fluorescence can be elevated by cellular autofluorescence, spectral overlap, and off-target antibody binding. Identifying the underlying source of background elevation is critical.
Elevated autofluorescence
Baseline autofluorescence varies significantly across cell types, activation states, and optical channels (especially shorter excitation wavelengths). High autofluorescence shifts the negative population to the right, rendering standard gating boundaries invalid. When comparing experimental conditions, ensure background autofluorescence remains consistent across groups; applying a single absolute fluorescence threshold across conditions with varying baseline autofluorescence invalidates percentage comparisons.
Dead cell interference
Dead and dying cells exhibit heightened autofluorescence and elevated non-specific antibody uptake due to compromised membrane integrity. Dead cells do not inherently increase target marker positivity; the artifact occurs when dead cells are inadvertently included in the target analysis gate. Failing to exclude dead cells via viability dyes causes false-positive scoring, driving up the calculated positive rate.
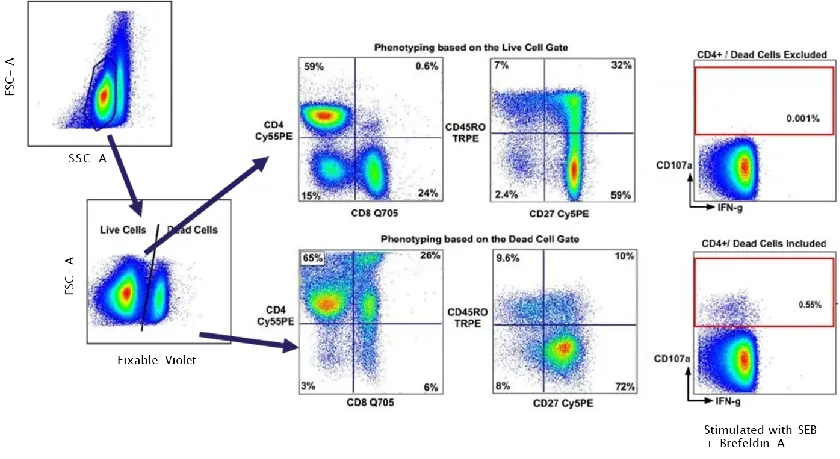
Figure 4: Impact of dead cell contamination on gating and positive rate determination
4. Multicolor Flow Cytometry Artifacts: Compensation Errors and Spillover Spreading
If single-stain controls show expected results but positivity for a given marker increases significantly in a multicolor panel, the issue likely originates from panel dynamics or compensation. Fluorophore emission spectra overlap, requiring mathematical compensation to correct spillover. Incorrect compensation matrix settings propagate errors into adjacent detector channels, creating population shifts and false-positive gates. Furthermore, compensation does not eliminate photon counting noise; measurement error associated with spectral spillover causes signal broadening, known as Spillover Spreading Error (SSE).
Discrepancies between single-stain and multicolor panels
When single-stain controls display clean separation but the negative population expands in the full panel, compare single-stain control profiles with fully stained samples. High-expression markers conjugated to bright fluorophores propagate significant photon noise into secondary channels, expanding negative population distributions and obscuring low-abundance markers. This typically presents as an increased positive percentage accompanied by loss of population resolution.
Distinguishing compensation errors from spillover spreading
Compensation corrects mean spillover signal, whereas SSE reflects the physical distribution spread of signal caused by photon statistics during spillover correction. Even with an accurate compensation matrix, intense fluorescence from one channel increases background variance in adjacent channels, broadening the negative population. For low-density antigens, this spreading makes resolving true negatives from weak positives challenging, artificially inflating positive event counts.
5. Data Analysis Standards and Gating Boundaries
If antibody staining, reagents, and instrument settings pass inspection, audit the data analysis workflow. Positive rate calculation depends directly on gate placement, gating hierarchy, and reference controls. While minor gate adjustments minimally affect well-separated populations, slight threshold shifts on continuous, low-density, or poorly resolved markers drastically alter calculated percentages.
Impact of threshold placement
Positivity represents the proportion of target events falling within a positive gate relative to the parent population. Shifting a gating boundary leftward into the background tail captures more background noise as positive events. When comparing experimental cohorts, maintain consistent, logically justified gating boundaries rather than adjusting gates manually to match visual expectations.
Controls for boundary definition
Fluorescence Minus One (FMO) controls define gating boundaries in complex multicolor panels by accounting for spillover spreading. Biological negative controls establish true baseline background levels. Note that single-stain controls serve to calculate compensation matrices, not to set positive gating boundaries. Relying solely on arbitrary empirical gates without proper negative references increases operator-dependent variance.
Inter-operator variability
Datasets featuring continuous antigen expression or poorly resolved populations can yield divergent positive rates when analyzed by different researchers due to subjective gating choices or differing parent population definitions. Troubleshooting requires reviewing the full gating hierarchy, reference controls, and raw bivariate dot plots or histograms rather than assessing summary percentages alone.
6. Systematic Troubleshooting Workflow
Follow a sequential, stepwise troubleshooting pathway rather than altering multiple variables simultaneously. First, characterize population shift dynamics, then systematically evaluate reagents, background noise, fluorescence optics, and gating strategies.
- Step 1: Characterize population dynamics: Compare positive and negative population positions, distribution widths, and resolution to determine whether target signal increased or overall background shifted.
- Step 2: Audit antibody parameters: Verify antibody clone, fluorophore conjugate, titration history, and concentration. Confirm whether excessive antibody concentration elevated background noise.
- Step 3: Evaluate non-specific binding: Ensure effective Fc receptor blocking was performed prior to staining.
- Step 4: Assess background fluorescence and cell viability: Inspect unstained and negative reference controls to detect elevated autofluorescence or unexcluded dead cells.
- Step 5: Review multicolor parameters: If artifacts occur exclusively in multicolor panels, inspect single-stain controls, compensation matrices, and spillover spreading effects.
- Step 6: Re-examine gating hierarchy: Verify upstream parent gates, positive gating thresholds, and control references to rule out subjective analysis shifts.
- Step 7: Synthesize with historical controls: Compare positive percentages alongside MFI, background signal, population resolution, and control performance to identify the root cause.
7. Common Artifacts and Troubleshooting Quick Guide
When investigating an unexpected increase in flow cytometry positive rates, the primary goal is not simply asking "why did the percentage increase," but identifying "which events were reclassified into the positive gate". Genuine target signal amplification warrants investigating biological or assay changes. Concurrent rightward shifts in negative populations point to background interference. Panel-specific anomalies indicate compensation or spillover spreading issues, while identical raw data yielding different results points to gating inconsistencies.
Reliable flow cytometry data relies on antibody specificity, optimized titration, defined background controls, accurate optical compensation, and consistent gating standards. Evaluating positive percentages in tandem with population positioning, MFI, background noise, and resolution ensures accurate biological conclusions.
Looking for Reliable Flow Cytometry Antibodies to Support your Experimental Workflows?
abinScience Flow Cytometry Antibodies are subjected to rigorous quality control to ensure consistent fluorescent performance and clear discrimination of cell populations, supporting robust and reproducible flow cytometry analyses.
Learn More about abinScience Flow Cytometry Antibodies
About Us
abinScience was founded in 2023 as a strategic venture of AtaGenix (established 2011), dedicated to delivering premium life science reagents that accelerate discovery.
abinScience flow cytometry antibody products cover commonly used detection markers, with a wide variety to meet the research needs of multiple species(
Human,
Mouse,
Rat,
Dog,
Hamster,
Monkey, etc.)We provide stable and reliable support for scientific research.

References
- [1] Nemoto, S., Mailloux, A. W., Kroeger, J., & Mulé, J. J. (2016). OMIP-031: Immunologic checkpoint expression on murine effector and memory T-cell subsets. Cytometry. Part A : the journal of the International Society for Analytical Cytology, 89(5), 427–429. https://doi.org/10.1002/cyto.a.22808
- [2] Cossarizza, A., Chang, H. D., Radbruch, A., Abrignani, S., Addo, R., Akdis, M., Andrä, I., Andreata, F., Annunziato, F., Arranz, E., Bacher, P., Bari, S., Barnaba, V., Barros-Martins, J., Baumjohann, D., Beccaria, C. G., Bernardo, D., Boardman, D. A., Borger, J., Böttcher, C., … Yang, J. (2021). Guidelines for the use of flow cytometry and cell sorting in immunological studies (third edition). European journal of immunology, 51(12), 2708–3145. https://doi.org/10.1002/eji.202170126
- [3] Andersen, M. N., Al-Karradi, S. N., Kragstrup, T. W., & Hokland, M. (2016). Elimination of erroneous results in flow cytometry caused by antibody binding to Fc receptors on human monocytes and macrophages. Cytometry. Part A : the journal of the International Society for Analytical Cytology, 89(11), 1001–1009. https://doi.org/10.1002/cyto.a.22995
- [4] Hulspas, R., O'Gorman, M. R., Wood, B. L., Gratama, J. W., & Sutherland, D. R. (2009). Considerations for the control of background fluorescence in clinical flow cytometry. Cytometry. Part B, Clinical cytometry, 76(6), 355–364. https://doi.org/10.1002/cyto.b.20485
- [5] Roederer M. (2001). Spectral compensation for flow cytometry: visualization artifacts, limitations, and caveats. Cytometry, 45(3), 194–205. https://doi.org/10.1002/1097-0320(20011101)45:3<194::aid-cyto1163>3.0.co;2-c
- [6] Nguyen, R., Perfetto, S., Mahnke, Y. D., Chattopadhyay, P., & Roederer, M. (2013). Quantifying spillover spreading for comparing instrument performance and aiding in multicolor panel design. Cytometry. Part A : the journal of the International Society for Analytical Cytology, 83(3), 306–315. https://doi.org/10.1002/cyto.a.22251


 中文
中文 English
 한국어
한국어 日本語
日本語 Español
 Français
 Русский


