When the same raw flow cytometry data is analyzed by different individuals, the reported percentages of positive cells can vary significantly—sometimes by several-fold. More often than not, this discrepancy stems not from instrument sensitivity or antibody quality, but from the gating strategy employed.
How gates are positioned, which events are included in the statistics, which cells are excluded upfront, and how the positive boundaries are defined all directly impact the final outcome. Fundamentally, flow cytometry gating is not merely about "drawing shapes on a plot"; it is a continuous process of answering a core question: Which events represent the target cells with true biological significance?
1. Data Quality Control: Essential Clean-up Prior to Gating
The core purpose of data quality control (QC) is not simply to "clean up random background noise," but to minimize the interference of non-biological factors on downstream analysis. Fluidic fluctuations, cellular debris, doublets, dead cells, and non-target cells can all be misidentified as true positive events in subsequent steps. Therefore, they must be systematically excluded before formal analysis begins.
Time Gating
By plotting a Time vs. Scatter/Fluorescence dot plot, researchers can monitor the stability of signal intensity and event rate over the course of sample acquisition. Air bubbles in the fluidics, sample precipitation, or variations in fluidic pressure can cause transient signal fluctuations, making events recorded within these intervals unreliable.
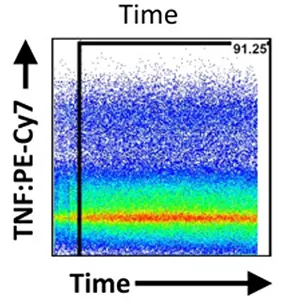
Figure 1. Excluding unstable fluidic signals using a Time gate (Source: OMIP-022)
If the time signal shows significant disruption or drift, the corresponding intervals should be discarded entirely, ensuring downstream analysis relies solely on a uniform and stable acquisition window. Though often overlooked in routine analysis, this step directly determines the cleanliness of the data background.
FSC/SSC Pre-screening
Forward scatter (FSC) and side scatter (SSC) are used to differentiate cell debris, target populations, and non-cellular particles, providing an initial localization of the population of interest.
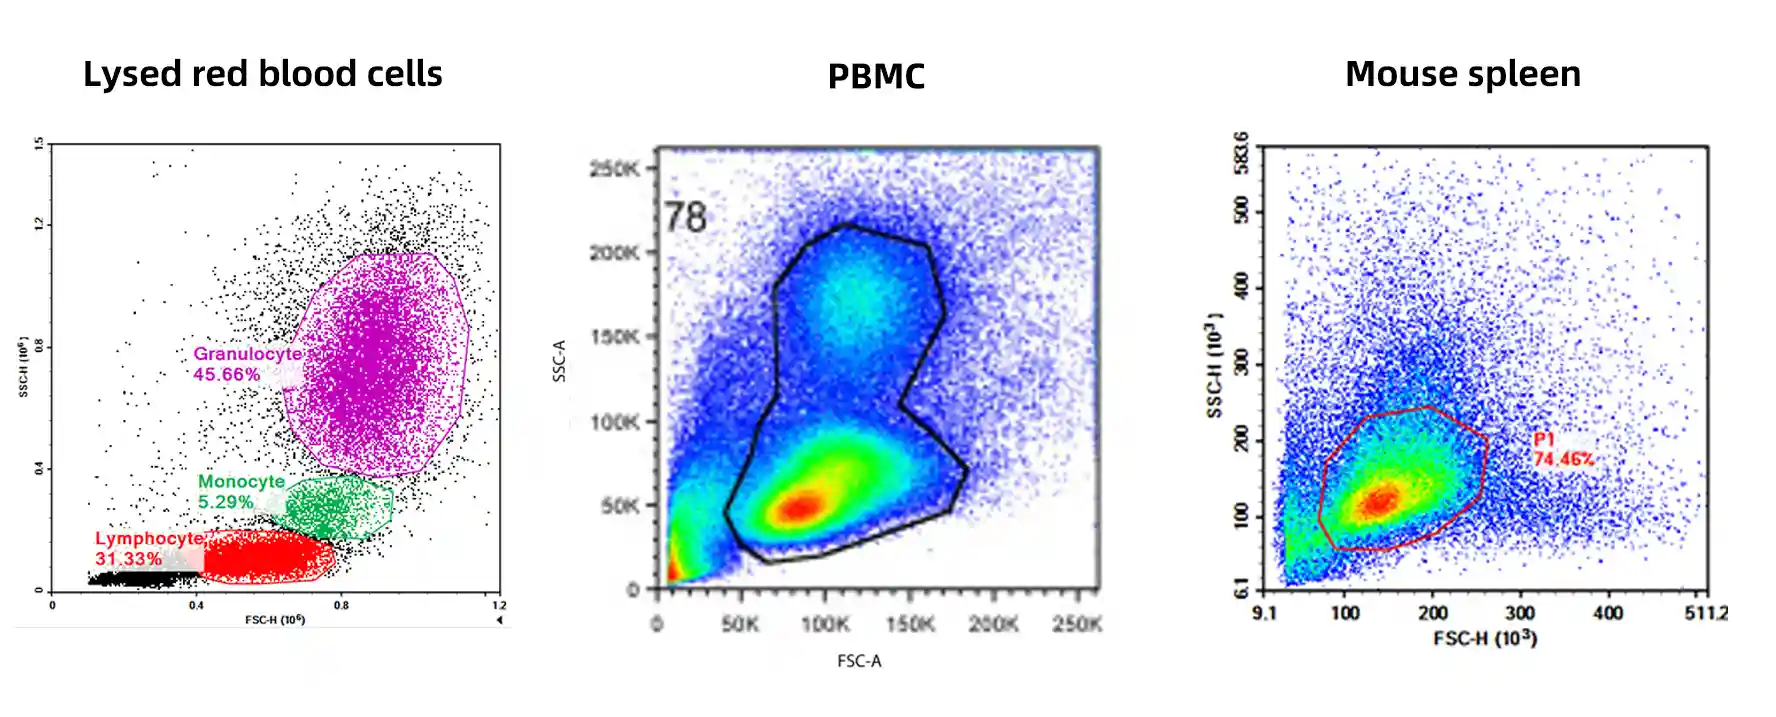
Figure 2. Representative FSC/SSC plots across different sample types
Scatter profiles vary drastically across sample types. Tissue-dissociated samples often contain abundant cellular debris and fibers, whereas cultured cell lines exhibit completely different scatter characteristics. It is critical to avoid blindly applying coordinate ranges from literature or historical templates; gating must be tailored to the FSC/SSC profile of the current sample to confirm the true position of the target population.
Doublet Discrimination
When two or more cells adhere due to cell-cell interactions or extracellular DNA, they pass through the laser beam as a single event. If these doublets or multiplets are not excluded, a single aggregate event might express markers from two distinct lineages, leading to false "double-positive" misclassifications and skewing true co-expression frequencies.
Doublet discrimination relies on pulse geometry characteristics—specifically, the relationship between pulse Area (A), Height (H), and Width (W). Single cells display a linear correlation between area and height, whereas doublets deviate from this trend. These are typically gated using FSC-A vs. FSC-H or FSC-W dot plots.
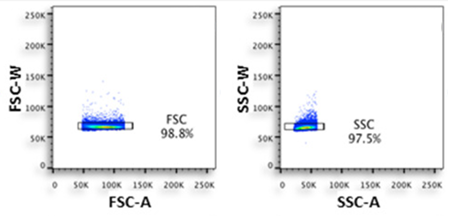
Figure 3. Doublet discrimination (Source: OMIP-020)
Doublet formation is particularly severe in tissue-dissociated samples, apoptotic cells, or highly adherent cell types (such as monocytes, macrophages, and dendritic cells). Even after applying a single-cell gate, researchers should remain vigilant against residual micro-doublets. The gate boundaries should be neither too tight nor too loose: over-gating discards valid single cells, while under-gating allows doublets to slip through. Generally, the gate should encompass the linear distribution of the main single-cell population.
Dead Cell Exclusion
FSC and SSC alone cannot reliably differentiate live and dead cells. Dead cells exhibit compromised membrane permeability, leading to extensive non-specific antibody binding. This causes an abnormal background shift across multiple fluorescence channels, generating significant false positives. Furthermore, DNA released from dead cells promotes cell clumping. Therefore, it is imperative to incorporate viability dyes (such as Zombie or Live/Dead Fixable series) to flag and exclude dead cells.
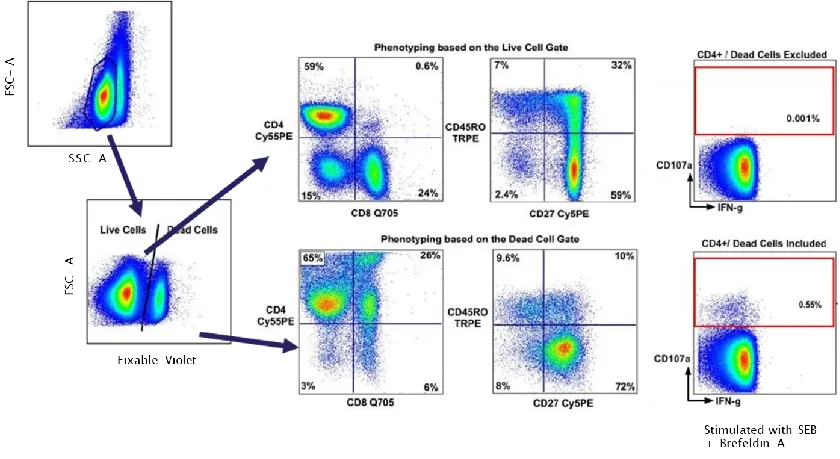
Figure 4. Interference of dead cells on experimental outcomes (DOI: 10.1016/j.jim.2006.04.007)
The non-specific staining resulting from dead cells is particularly pronounced for certain fluorophores; tandem dyes are especially sensitive to non-specific binding by dead cells, which easily creates artifacts like false "double-positives" or artificial continuous expression patterns.
In practice, flow cytometric clean-up extends beyond dead cells to include various non-target populations that interfere with downstream identification. Many experimental panels implement a "dump channel" strategy, utilizing negative selection markers to eliminate irrelevant cell types upfront. For example, when analyzing lymphocytes or T cells, CD14 and CD19 are often bundled to exclude monocytes and B cells; for NK cell analysis, CD3 is standard for clearing T cells. In complex tissue specimens, markers like CD66b and Ter119 may be added to further eliminate granulocytes or erythroid cells.
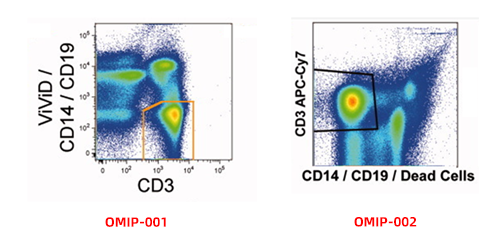
Figure 5. Exclusion of non-target events using negative selection markers and viability dyes
It is worth noting that data QC does not follow a rigid, one-size-fits-all protocol. The sequence of time gating, FSC/SSC pre-screening, doublet discrimination, and dead cell exclusion can be flexibly adjusted based on sample type, instrument status, and experimental goals. Not every assay requires every single step to be executed comprehensively.
For instance, high-quality PBMC samples might skip stringent time gating, whereas tissue digests, tumor biopsies, or extended acquisitions demand highly rigorous data-cleaning protocols. The ultimate priority is not the mechanical execution of a fixed sequence, but ensuring that the final events entering analysis carry stable, credible, and reproducible biological relevance.
2. Defining Downstream Cellular Subsets
The most common approach to subsetting is sequential gating (hierarchical gating). Its core philosophy relies on step-by-step restriction to progressively enrich the purity of the target population. Each subsequent gate is constructed upon the refined population derived from the preceding tier, rather than reverting back to the total pool of raw events.
Take the NK cell subsetting strategy from OMIP-029 as an example:
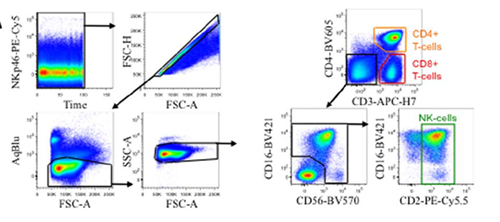
Figure 6. NK cell subsetting analysis (Source: OMIP-029)
Unstable signals are excluded via a Time gate; doublets are eliminated using FSC-A/H; dead cells are excluded via a viability dye; lymphocytes are isolated via FSC/SSC; and T cells are identified and segregated using CD3/CD4. Within the remaining CD3-CD4- pool, CD16⁻CD56⁻ events are gated out, ultimately isolating the CD2+ NK cell population.
Notably, NK cells are not defined merely by a single CD56 marker. Analyzing CD56 directly across all events would inadvertently sweep monocytes, activated T cells, and dead cell backgrounds into the statistics. Thus, OMIP-029 first clears T cell-related populations via CD3/CD4, defines the NK cell boundary using CD16/CD56 on the remaining events, and finally refines the population with CD2 to maximize purity. This "exclude first, define later" approach represents a classic logic in flow cytometry gating.
Flow cytometry gating is inherently a process of progressive purification. Parent gates establish the foundation for downstream analysis, while child gates iteratively sharpen the definition of the target population.
Because experimental objectives vary, there is no fixed template for gating pathways:
- • PBMC samples typically use the lymphocyte gate as the primary analytical entry point.
- • Tumor tissues require much tighter exclusion of dead cells and debris due to elevated necrosis.
- • Bone marrow samples rely heavily on SSC profiles to resolve cells at distinct developmental stages.
Consequently, benchmark gating trees from literature should serve as conceptual frameworks rather than rigid formulas. A truly sound gating strategy must be built on the realities of the current sample type, staining panel, and experimental endpoints.
3. Setting the Boundaries: Gating Depends on Proper Controls
The central dilemma in gating is always: "Where exactly should the line be drawn?" In the scientific community, universally accepted gating boundaries are dictated by systematic experimental controls.
Fluorescence Minus One (FMO) Controls
An FMO control tube contains all the fluorophores used in the experimental panel except for the one being evaluated. Its purpose is to reveal the background fluorescence and spread (spillover spreading error) into the target channel under a "theoretically negative" state, providing a baseline for drawing the positive boundary.
In multicolour panels, an FMO control should be included for every critical marker—particularly those with low expression, continuous/smear staining patterns, or those serving as the definitive threshold between positive and negative populations. It remains one of the most reliable references for setting gating boundaries.
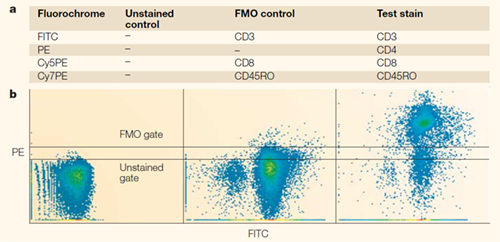
Figure 7. Gating boundaries defined by FMO controls (DOI: 10.1038/nri1416)
Isotype Controls
Isotype controls utilize antibodies of the same host species, immunoglobulin isotype, and fluorophore as the target antibody, but lack specificity for the target antigen. While historically used to estimate non-specific binding, isotype controls fail to account for spillover spreading error in modern multicolour flow cytometry. Furthermore, non-specific binding varies dramatically across cell types. For these reasons, they are no longer recommended as an independent baseline for gating.
Biological Controls
Examples include unstimulated vs. stimulated samples, knock-out vs. wild-type models, or blocking experiments with neutralizing antibodies. These are designed to verify that the detected signal is truly induced by the experimental treatment. Biological controls primarily confirm the presence or absence of a biological response; they are generally unsuitable as the sole metric for precisely defining a positive gate.
The best practice is to pair biological controls with FMO controls: use the FMO to establish the mathematical boundary, and use the biological control to validate its biological relevance.
4. Common Troubleshooting Pitfalls and Solutions
| Issue |
Manifestation / Cause |
Optimization Strategy |
| Poor Population Resolution |
Blurred boundaries between subsets; overlapping clusters on dot plots. |
Optimize antibody titration, extend incubation times, recalibrate compensation, and implement rigorous dead cell/non-target exclusion. |
| Weak Positive Signals |
Low separation between positive and negative populations (not always indicative of low antigen expression; can be caused by dull fluorophores, spillover spreading, or sub-optimal fixation/permeabilization). |
Focus on improving resolution (staining index) rather than just maximizing raw fluorescence intensity. |
| Non-specific Staining |
Elevated background due to antibody excess, over-incubation, unblocked Fc receptors, or non-specific binding by dead cells. |
Lower antibody concentration, shorten incubation times, use Fc receptor blocking reagents, and stringently exclude dead cells. |
| Gating Rare Populations |
High background noise or overlapping positive/negative signals make low-frequency subsets difficult to resolve. |
Increase the number of acquired events, utilize pre-enrichment techniques, choose brighter fluorophores/more sensitive detectors, and heavily rely on FMO controls. |
Conclusion: Gating Is Cell Definition, Not Drawing Lines
More often than not, discrepancies in flow cytometry results do not arise from instrument sensitivity or antibody performance, but rather from how the analyst defines which cells are statistically relevant.
While gates appear as mere boundaries on a dot plot, they represent a continuous effort to answer a central question: Which events constitute the target cells with true biological significance? Every step—whether it involves excluding debris, eliminating doublets, filtering out dead cells, or restricting lineage markers—is fundamentally designed to drive up the purity and definition accuracy of the target population.
As such, flow cytometry gating is never just a mechanical drawing skill. It is a data-filtering ecosystem rooted in sample characteristics, experimental objectives, control setups, and biological logic. Parent gates dictate the baseline for downstream analysis, while child gates iteratively narrow the focus to ensure the final output mirrors the true biological state as closely as possible.
A truly robust gating strategy lacks a rigid template. Diverse sample matrices, distinct research goals, and varying staining panels will always shift the optimal analytical pathway. Rather than mindlessly mimicking benchmark literature, it is far more critical to grasp the underlying rationale behind each gate: Why exclude these events? Why position the gate here? Which events must be kept out of the final statistics?
Only when the gating logic, control matrix, and experimental goals align harmoniously can raw fluorescence signals be transformed into trustworthy biological conclusions.
About Us
As a strategic venture of AtaGenix (established 2011), abinScience specializes in the development and production of high-quality life science reagents, and is committed to providing researchers with high-performance, highly reliable Flow Cytometry Antibodies, we offer:
1. Stringently validated flow cytometry antibodies including CD3, CD4, CD8 ensuring high sensitivity and minimal background noise;
2. A comprehensive portfolio of immunology research tools for multiple species, including Human, Mouse, Rat, Dog, Hamster, etc.;
3. Expert technical support and panel design consultation to help you accurately resolve complex immune cell populations.
For more information on abinScience flow cytometry antibodies, please visit:
abinScience Flow Cytometry Antibodies
Reference:
- [1] Mahnke, Y. D., & Roederer, M. (2010). OMIP-001: Quality and phenotype of Ag-responsive human T-cells. Cytometry. Part A : the journal of the International Society for Analytical Cytology, 77(9), 819–820. https://doi.org/10.1002/cyto.a.20944
- [2] Chattopadhyay, P. K., Roederer, M., & Price, D. A. (2010). OMIP-002: Phenotypic analysis of specific human CD8+ T-cells using peptide-MHC class I multimers for any of four epitopes. Cytometry. Part A : the journal of the International Society for Analytical Cytology, 77(9), 821–822. https://doi.org/10.1002/cyto.a.20945
- [3] Graves, A. J., Padilla, M. G., & Hokey, D. A. (2014). OMIP-022: Comprehensive assessment of antigen-specific human T-cell functionality and memory. Cytometry. Part A : the journal of the International Society for Analytical Cytology, 85(7), 576–579. https://doi.org/10.1002/cyto.a.22478
- [4] Mahnke, Y. D., Beddall, M. H., & Roederer, M. (2015). OMIP-029: Human NK-cell phenotypization. Cytometry. Part A : the journal of the International Society for Analytical Cytology, 87(11), 986–988. https://doi.org/10.1002/cyto.a.22728
- [5] Perfetto, S. P., Chattopadhyay, P. K., & Roederer, M. (2004). Seventeen-colour flow cytometry: unravelling the immune system. Nature reviews. Immunology, 4(8), 648–655. https://doi.org/10.1038/nri1416
- [6] Perfetto, S. P., Chattopadhyay, P. K., Lamoreaux, L., Nguyen, R., Ambrozak, D., Koup, R. A., & Roederer, M. (2006). Amine reactive dyes: an effective tool to discriminate live and dead cells in polychromatic flow cytometry. Journal of immunological methods, 313(1-2), 199–208. https://doi.org/10.1016/j.jim.2006.04.007
- [7] Wistuba-Hamprecht, K., Pawelec, G., & Derhovanessian, E. (2014). OMIP-020: phenotypic characterization of human γδ T-cells by multicolor flow cytometry. Cytometry. Part A : the journal of the International Society for Analytical Cytology, 85(6), 522–524. https://doi.org/10.1002/cyto.a.22470

 中文
中文 English
 한국어
한국어 日本語
日本語 Español
 Français
 Русский