In flow cytometry (FCM) experiments, autofluorescence can affect the distribution of negative populations, the resolution of positive populations, and the detection results of low-expression markers. This issue is particularly critical for myeloid cells, tissue-derived cells, or samples with fluorescent protein signals such as GFP and RFP. The degree of autofluorescence interference depends on the sample's intrinsic fluorescent characteristics, target signal intensity, detection channels, fluorochrome combinations, and instrument configuration.
Unexpected positive populations in experimental results, broadened distributions of negative populations, difficulty in distinguishing weak positive signals, or similar fluorescence changes across multiple channels for different cell populations can all be associated with autofluorescence.
1. Which Fluorescent Signals Can Affect Detection?
Sample backgrounds may originate from endogenous intracellular fluorescent components or existing fluorescent proteins such as GFP and RFP. Cell types, physiological states, and treatment conditions all influence background intensity and spectral distribution; therefore, assessments should be based on actual samples and instrument configurations.
| Source or Type |
Common Relevant Scenarios |
Potential Impact on Flow Cytometry Detection |
| Cellular metabolism-related fluorescent components, such as NAD(P)H and flavins |
Cells of different types, metabolic states, or physiological states |
Background intensity and distribution may vary, affecting signal separation in certain detection regions |
| Intracellular components with broad-spectrum fluorescence characteristics, such as lipofuscin |
Certain tissue cells, senescent cells, and specific primary samples |
May form background across multiple detection regions, increasing the difficulty of interpreting weak positive populations |
| Other fluorescent components related to cell type or physiological state |
Certain tissue-derived cells, activated or treated cell populations |
Background may vary across cell populations, and bulk background cannot fully represent the target population |
| Fluorescent protein signals, such as GFP and RFP |
Reporter gene systems, stably expressing cells, and cell tracking experiments |
Existing fluorescence may overlap with detection signals from antibody fluorochromes, impairing target signal resolution |
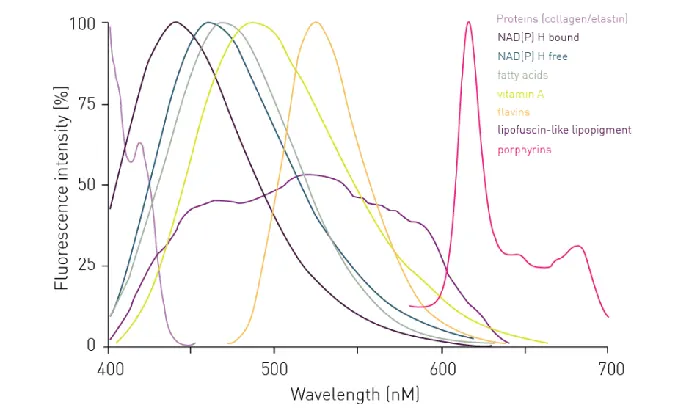
Figure 1. Emission spectra of different autofluorescence sources.
Therefore, experimental design should not pre-assume that a certain cell type inherently exhibits high background, nor should it judge suitability for a specific dye solely based on the background intensity of a single channel. More importantly, it requires evaluating the background intensity, distribution width, and population-to-population differences of the target cell population across various detection regions on the current instrument.
2. Clues for Identifying Autofluorescence Interference in Flow Cytometric Data
2.1 Shift, Broadening, or Tailing of the Negative Population
First, examine the histogram or dot plot of unstained samples in the target channel, and compare it with fully stained samples. If unstained cells show a broad distribution, tailing, or extension into the expected positive region, background may be contributing to signal distribution. If the anomaly appears exclusively in fully stained samples, other factors such as antibody staining, spillover, and compensation must be investigated.
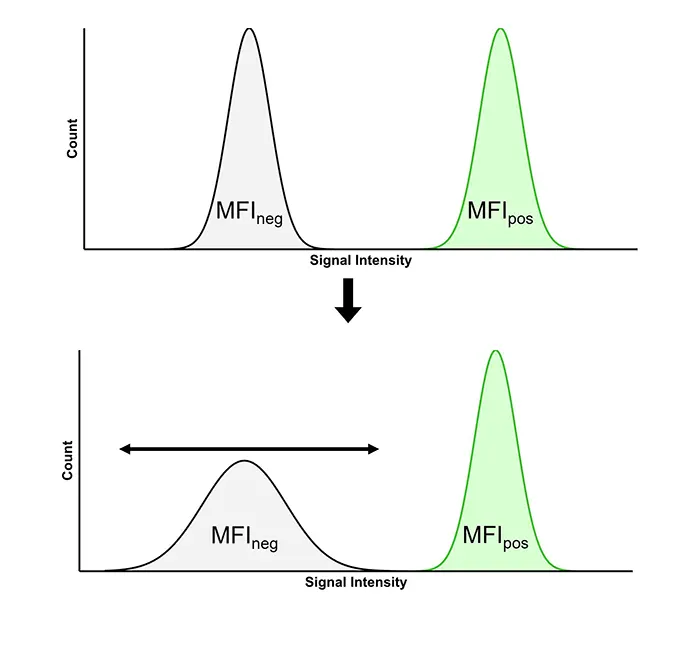
Figure 2. Autofluorescence causing broadening of the negative cell population distribution.
In addition to MFI, observe the width of the negative distribution and the spacing between negative and positive populations. Low-expression markers or rare positive populations are prone to overlap and become difficult to identify. If the positive rate fluctuates significantly with minor adjustments to the gate position, it indicates unstable population separation, which cannot be resolved simply by moving the gate boundary.
2.2 Differences in Distribution Among Cell Populations in the Target Channel
In mixed samples, first identify target cell populations using scatter characteristics and existing markers, then examine the unstained distributions of each population separately. If the anomaly is concentrated in a specific population, subsequent evaluations should focus on that population, avoiding the use of whole-sample distribution to represent all cells.
2.3 Correlated Signals Across Multiple Detection Regions Within the Same Cell Population
If the same cell population exhibits elevated background or broadened distribution simultaneously across multiple detection regions, cross-band endogenous fluorescence or GFP/RFP signals should be investigated. This serves merely as an initial clue and still requires confirmation using unstained samples, single-color controls, and instrument configurations.
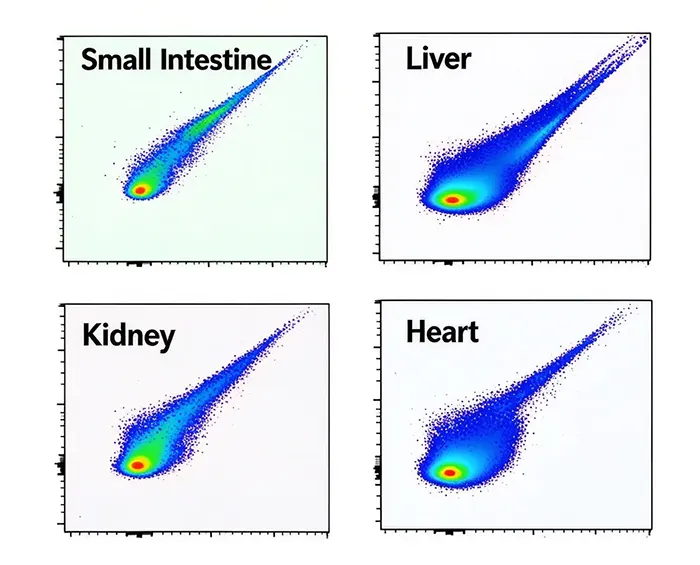
Figure 3. Interference of autofluorescence from different tissues on experimental results (showing diagonal tailing extending toward the upper right corner, a signal that cannot be eliminated by conventional fluorescence compensation adjustments).
3. How to Mitigate Autofluorescence Interference Through Panel Design and Experimental Optimization
3.1 Tailor Dye Assignment Based on Background Distribution
Before finalizing a panel, use unstained samples processed under conditions identical to the actual experiment to observe the background distribution of target cell populations across detection regions, paying close attention to the distribution width of negative populations and differences among cell populations.
For low-expression markers, rare positive populations, or markers requiring subtle expression changes to be resolved, detection combinations with relatively favorable backgrounds and superior signal separation should be prioritized. High-expression markers generally have less stringent brightness requirements and can be flexibly assigned based on overall panel layout, though their spillover impact on other detection regions must be evaluated.
For samples expressing fluorescent proteins such as GFP and RFP, existing fluorescence must also be incorporated into panel design to evaluate its spectral relationship with candidate antibody fluorochromes. Dye selection must combine actual instrument configuration, target marker expression features, and inter-signal relationships across the entire panel, rather than relying solely on brightness or emission peaks.
For example, if certain cell populations in myeloid cell samples exhibit a broad background distribution while the target low-expression marker has a weak signal, priority should be given to ensuring optimal detection conditions for that marker before evaluating dye assignments for other markers, thereby preventing spillover spreading from further diminishing target population resolution.
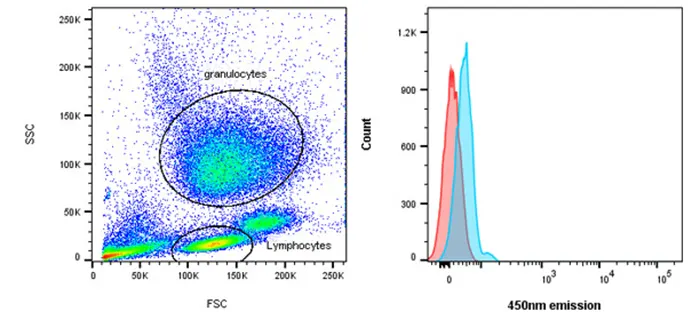
Figure 4. Autofluorescence of lymphocytes (red) is lower than that of granulocytes (blue).
3.2 Optimize Protocols Based on Actual Detection Performance
If preliminary detection reveals significant broadening of negative populations or difficulty in distinguishing weak positive populations, evaluate potential interference sources using appropriate controls before deciding whether to modify the panel. If the target detection region is significantly impacted by sample background, re-evaluate candidate fluorochromes for the target marker. If the primary issue stems from spillover spreading by other dyes, consider adjusting dye assignments for related markers.
Traditional flow cytometry compensation is used to correct spectral spillover between different fluorochromes, but it cannot eliminate cellular autofluorescence nor necessarily restore compromised population resolution. Spectral flow cytometry can reduce the impact of autofluorescence on experimental results through spectral unmixing.
The goal of optimization is to improve the actual separation of key cell populations, rather than achieving desired positive rates through repeatedly shifting gating boundaries.
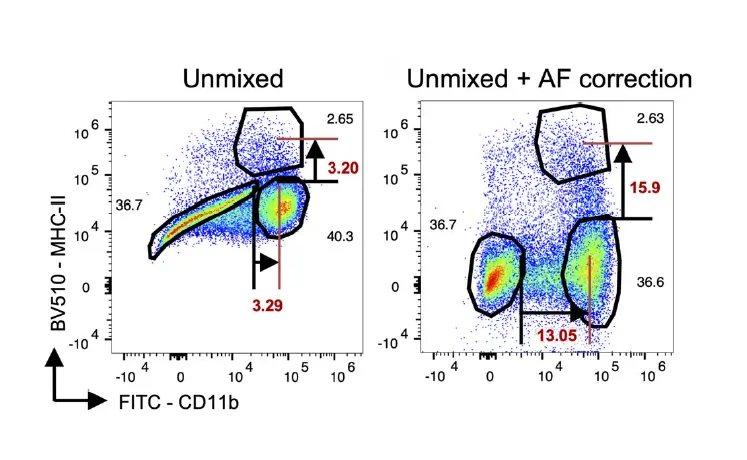
Figure 5. Spectral flow cytometry utilizing spectral unmixing to reduce autofluorescence interference.
4. How to Determine Whether Autofluorescence Has Affected Final Results
Data interpretation should focus on the target cell population and target channel. Unstained controls are used to understand background distribution in the absence of antibody fluorochromes, but they cannot independently prove that signals in fully stained samples originate from the target marker; GFP/RFP samples can also use controls without antibody fluorochromes to confirm the established fluorescence range.
FMO controls retain all fluorochromes except the one for the target antibody, allowing evaluation of the combined impact of background and spillover spreading from other fluorochromes on the target region, thereby assisting in defining weak positive boundaries. FMO controls cannot rule out non-specific antibody binding, nor can they replace single-color controls. Controls should be chosen based on the specific question being addressed.
Using the same gating strategy to identify target cell populations, compare unstained controls, FMO controls, and fully stained samples side-by-side. Focus on whether the negative distribution broadens, whether a gap remains between the target signal and the background, and whether population locations and separation trends are consistent across replicate samples. If minor shifts in gating boundaries cause substantial changes in positive rates, return to panel design to troubleshoot.
For GFP/RFP samples, evaluate whether existing fluorescence impacts target detection using antibody-free controls, single-color controls, and applicable FMO controls. Positive determination is reliable only when the target population can be stably resolved from the background with reproducible results. If separation remains unachievable after adjusting dyes, the panel should be redesigned rather than repeatedly moving gate lines.
Conclusion
Autofluorescence evaluation should run through every stage of flow cytometry experimental design, detection, and analysis: first determine the background distribution of the target population, then assign fluorochromes according to the detection requirements of key markers, and finally confirm population reliability using appropriate controls. For samples with complex backgrounds or expressing GFP/RFP, there is no universal fixed combination; the key is whether the current panel can stably distinguish target signals from background under actual sample and instrument conditions.
References
- [1] Cossarizza, A., Chang, H. D., Radbruch, A., Abrignani, S., Addo, R., Akdis, M., Andrä, I., Andreata, F., Annunziato, F., Arranz, E., Bacher, P., Bari, S., Barnaba, V., Barros-Martins, J., Baumjohann, D., Beccaria, C. G., Bernardo, D., Boardman, D. A., Borger, J., Böttcher, C., … Yang, J. (2021). Guidelines for the use of flow cytometry and cell sorting in immunological studies (third edition). European Journal of Immunology, 51(12), 2708–3145. https://doi.org/10.1002/eji.202170126
- [2] Nguyen, R., Perfetto, S., Mahnke, Y. D., Chattopadhyay, P., & Roederer, M. (2013). Quantifying spillover spreading for comparing instrument performance and aiding in multicolor panel design. Cytometry. Part A : the journal of the International Society for Analytical Cytology, 83(3), 306–315. https://doi.org/10.1002/cyto.a.22251
- [3] Bhowmick, D., van Diepen, F., Pfauth, A., Tissier, R., & Ratliff, M. L. (2021). A gain and dynamic range independent index to quantify spillover spread to aid panel design in flow cytometry. Scientific Reports, 11(1), 20553. https://doi.org/10.1038/s41598-021-99831-7
- [4] Roederer M. (2016). Distributions of autofluorescence after compensation: Be panglossian, fret not. Cytometry. Part A : the journal of the International Society for Analytical Cytology, 89(4), 398–402. https://doi.org/10.1002/cyto.a.22820
- [5] Nolan, J. P., Condello, D., Duggan, E., Naivar, M., & Novo, D. (2013). Visible and near infrared fluorescence spectral flow cytometry. Cytometry. Part A : the journal of the International Society for Analytical Cytology, 83(3), 253–264. https://doi.org/10.1002/cyto.a.22241
- [6] Nolan, J. P., & Condello, D. (2013). Spectral flow cytometry. Current Protocols in Cytometry, Chapter 1, 1.27.1–1.27.13. https://doi.org/10.1002/0471142956.cy0127s63
Looking for Reliable Flow Cytometry Antibodies to Support your Experimental Workflows?
abinScience Flow Cytometry Antibodies are subjected to rigorous quality control to ensure consistent fluorescent performance and clear discrimination of cell populations, supporting robust and reproducible flow cytometry analyses.
Learn More about abinScience Flow Cytometry Antibodies
About Us
abinScience was founded in 2023 as a strategic venture of AtaGenix (established 2011), dedicated to delivering premium life science reagents that accelerate discovery.
abinScience flow cytometry antibody products cover commonly used detection markers, with a wide variety to meet the research needs of multiple species(Human, Mouse, Rat, Dog, Hamster, Monkey, etc.)We provide stable and reliable support for scientific research.



 中文
 English
 한국어
 日本語
 Español
 Français
 Русский


