Flow cytometry antibodies are among the most essential analytical tools in modern immunology, cell biology, and biomedical research. By enabling multiparametric characterization of individual cells in heterogeneous suspensions, flow cytometry provides granular biological insights that bulk analytical methods cannot replicate. However, researchers frequently encounter scenarios where two commercial antibodies targeting the exact same protein marker yield strikingly different results. One reagent may produce a crisp, brightly separated target population, whereas another displays weak fluorescence, elevated background noise, or poor population resolution. Although both reagents may carry the manufacturer's label as "validated for flow cytometry," their practical performance in actual assays can diverge significantly.
This variability stems from the fundamental nature of flow cytometry analysis. Unlike Western blotting, where a single discrete band at an expected molecular weight often serves as a primary benchmark for target detection, flow cytometry measures continuous distributions of fluorescence intensity across thousands of individual cells. Consequently, assay resolution depends not merely on whether a signal is present, but on the delicate balance between target‑specific binding, non‑specific background noise, population distribution spread, fluorophore conjugation chemistry, and baseline cellular matrix effects.
Why a Positive Signal Does Not Tell the Whole Story
When evaluating a flow cytometry antibody, the first question is often:
“Does this antibody detect my target?”
However, a positive signal alone does not fully describe antibody performance.
A flow cytometry result is a distribution of fluorescence intensities rather than a simple positive or negative outcome. A good antibody should not only produce a signal from target‑positive cells, but should also provide sufficient separation between positive and negative populations.
For example, two antibodies may both detect a CD marker on a positive cell population:
- • Antibody A generates a strong positive signal with low background.
- • Antibody B also generates a positive signal, but the negative population shifts upward and overlaps with the positive population.
Although both antibodies are technically “positive”, their usefulness in a real experiment may be very different, especially when analyzing low‑expression markers or designing complex multicolor panels.
Therefore, reliable flow cytometry antibody evaluation requires consideration of several aspects:
- • Signal intensity: How strong is the fluorescence signal?
- • Background level: How much non‑specific staining is present?
- • Population separation: How clearly can positive and negative populations be distinguished?
- • Biological relevance: Does the validation system reflect the intended application?
- • Reproducibility: Does the antibody perform consistently between batches?
A brighter signal does not always mean a better antibody. In flow cytometry, resolution and reliability are often more important than fluorescence intensity alone.
What Researchers Actually See: Reading Supplier Flow Cytometry Validation Data
In most cases, researchers do not have access to a supplier’s complete internal QC dataset. Product pages and technical documents usually provide representative validation data, such as:
- • Histogram overlays
- • Dot plots or population plots
- • Positive and negative staining patterns
- • Sample information
- • Experimental conditions, when available
These results are the visible outcome of a broader validation process. Internal QC data, such as detailed acceptance criteria, batch‑release evaluation records, or complete quantitative performance datasets, are generally part of the supplier’s quality system rather than routinely published product information.
Therefore, when reviewing supplier validation data, researchers should focus on understanding what the displayed results actually demonstrate.
2.1 Sample Context and Expression Abundance
In antibody validation and quality control, overexpressed and endogenous (natural) samples serve as two distinct yet complementary validation models:
- • Overexpressed Samples: Characterized by high target abundance and a defined baseline, overexpressed models can serve as useful positive validation systems for confirming target recognition, evaluating signal generation, and supporting antibody characterization.
- • Endogenous/Natural Samples: Reflecting physiological expression levels, native cellular contexts, and biological variability, providing complementary information on antibody performance under biologically relevant conditions.
2.2 Population Separation Clarity and Distribution Morphology
A useful validation plot should allow researchers to evaluate:
- • The position of the positive population
- • The background level of negative cells
- • The degree of overlap between populations
- • Whether the staining pattern is biologically reasonable
A histogram with a shifted positive peak is informative, but the interpretation depends on the entire staining context.
2.3 Are controls appropriately considered?
Understanding the controls shown on supplier datasheets is essential for correct data interpretation. In commercial antibody manufacturing, baseline quality control testing consists almost exclusively of single‑color staining assays (with occasional two‑color characterizations). Common controls used in supplier validation workflows may include:
- • Unstained / Blank Controls: Target cell populations analyzed without antibody staining to establish baseline intrinsic cell autofluorescence.
- • Negative Sample Controls: Cell lines or primary cell subsets naturally lacking target antigen expression (or gene‑knockout models) stained with the antibody to quantify non‑specific binding.
- • Isotype Controls: Matching non‑targeting immunoglobulins conjugated to the same fluorophore at identical concentrations to evaluate non‑specific Fc receptor binding and hydrophobic cell interaction.
Why Flow Cytometry Antibodies Against the Same Target Can Perform Differently
When two commercial antibodies targeting the same marker produce dissimilar flow cytometry profiles, it does not automatically imply that one reagent is defective. Staining variation is driven by an interplay of biological, biochemical, fluorometric, and procedural variables.
3.1 Biological and Structural Factors
Monoclonal antibodies generated against the same protein target distinct structural or conformational epitopes. Epitope accessibility is highly sensitive to cell surface microenvironments, protein folding, activation states, and secondary modifications such as glycosylation. Furthermore, sample preparation procedures involving aldehyde fixation or alcohol permeabilization can alter or destroy delicate conformational epitopes, leading to marked variations in staining intensity between clones.
Target antigen density also dictates staining profiles. High‑abundance markers (e.g., CD45 on lymphocytes) are readily detected even by lower‑affinity clones or dimmer fluorophores. Conversely, low‑abundance markers (e.g., cytokine receptors, transcription factors) require high‑affinity antibody clones coupled to bright fluorophores to achieve sufficient signal above baseline noise.
3.2 Biochemical Properties and Antibody Purity
The biochemical integrity of the raw antibody directly impacts flow cytometry resolution. Unconsolidated antibody preparations containing soluble aggregates, denatured fragments, or protein contaminants exhibit heightened non‑specific adherence to cell membranes and Fc receptors. High‑quality antibody manufacturing requires rigorous purification via protein A/G chromatography and size‑exclusion chromatography (SEC) to ensure monomeric purity and optimal binding kinetics.
3.3 Fluorochrome Selection and Conjugation Chemistry
The fluorophore attached to an antibody exerts a profound influence on performance. Fluorophores vary widely in extinction coefficient, quantum yield, laser excitation efficiency, and environmental stability. Large protein fluorophores like Phycoerythrin (PE) and Allophycocyanin (APC) deliver exceptional brightness but possess high molecular weights that require precise conjugation chemistry to avoid steric hindrance.
The Degree of Labeling (DOL)—defined as the average number of fluorophore molecules conjugated per antibody molecule—must be stringently controlled. Excessive fluorochrome labeling may affect antibody performance differently depending on fluorochrome type: for small‑molecule organic dyes, excessive labeling often causes self‑quenching and reduced brightness; for large protein fluorochromes such as PE and APC, excessive labeling may affect antigen accessibility, molecular stability, and overall conjugate performance, potentially resulting in reduced binding activity or increased background staining.
3.4 Operational and Cytometric Variables
Flow cytometry results are strongly influenced by experimental execution and instrument configuration. Factors including cell washing efficiency, incubation temperature and duration, buffer composition, fixation/permeabilization protocols, laser power, detector gain (PMT/APD voltages), and optical filter bandwidths can all alter measured fluorescence intensities between laboratories.
Critically, these variables do not affect all antibodies equally. Clones with lower antigen affinity, suboptimal fluorophore conjugation, or higher levels of protein aggregates are far more sensitive to deviations in staining conditions. This means performance gaps between two antibodies targeting the same marker often become even more pronounced under non‑optimized or routine experimental conditions, rather than the controlled settings used in supplier validation.
Therefore, differences between suppliers should be interpreted in the context of the entire validation system.
The QC Metrics Behind Flow Cytometry Antibody Performance
Suppliers often evaluate antibody performance using quantitative parameters that help describe signal quality. These metrics do not replace biological interpretation, but they provide objective ways to compare performance under controlled conditions.
4.1 Is the target population detected? — Percentage Positive
Percentage Positive defines the proportion of total analyzed cellular events falling within a gated positive boundary. While useful for verifying target cell frequency in defined biological models, Percentage Positive depends heavily on gating placement, baseline cell viability, and expression thresholds. A high percentage positive value does not inherently demonstrate reagent quality if the positive population overlaps extensively with negative background.
4.2 How strong is the signal? — Positive MdFI
Median fluorescence intensity (MdFI) describes the median fluorescence level of a population. Compared with mean fluorescence intensity, median values are less affected by extreme events and are commonly used for flow cytometry data analysis.
Positive MdFI helps answer: How strong is the signal generated from target‑positive cells? However, MdFI should not be interpreted as an absolute quality score. It depends on:
- • Instrument settings
- • Detector configuration
- • Fluorochrome characteristics
- • Staining conditions
Therefore, MdFI comparisons are most meaningful when performed under controlled and comparable conditions.
4.3 How high is the background? — Negative MdFI
Positive signal is only one side of antibody performance.
Negative MdFI reflects fluorescence from cells expected to lack the target.
Higher background may result from factors such as:
- • Non‑specific binding
- • Fc receptor interactions
- • Dead cell staining
- • Antibody aggregation
A strong antibody should ideally provide strong positive staining while maintaining low background.
4.4 Can populations be separated clearly? — S/N and Stain Index
Signal‑to‑noise ratio (S/N) compares positive signal with negative background:
S/N = Positive MdFI ÷ Negative MdFI
While S/N offers a useful initial screening value, it fails to account for distribution width or population spread. Two antibodies may possess identical S/N ratios, yet display drastically different resolution if one exhibits a broad negative distribution that overlaps with positive events.
To overcome this limitation, the Stain Index (SI) incorporates the standard deviation of the negative population (SD negative), offering a comprehensive parameter for population separation clarity:
SI = (MdFIpositive − MdFInegative) / (2 × SDnegative)
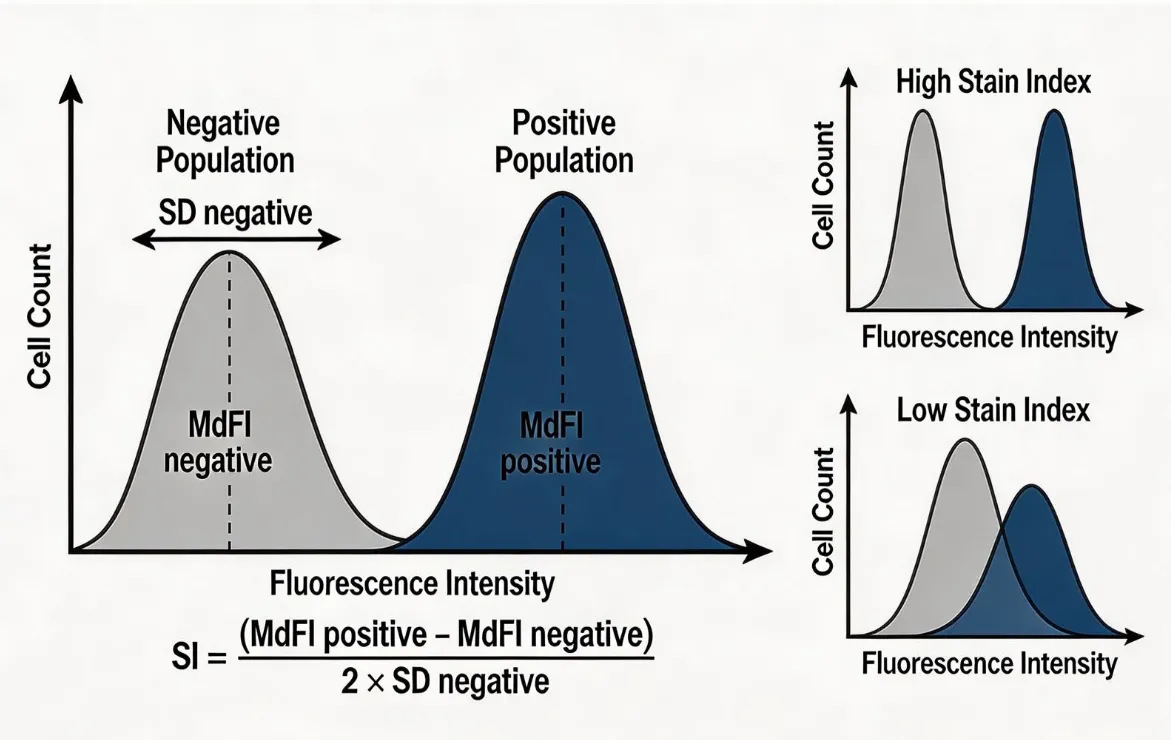
Figure 1. Schematic of the Stain Index (SI) calculation principle.
The Stain Index quantifies normalized population resolution relative to background noise spread. Higher SI values denote superior population separation, making SI an invaluable metric during fluorophore selection, clone screening, and panel design.
4.5 What about heterogeneous populations? — Separation Index
For markers featuring continuous or heterogeneous expression profiles—where positive populations display broad distribution widths—the Separation Index incorporates standard deviations from both positive and negative populations:
Separation Index = (MdFIpositive − MdFInegative) / (SDpositive + SDnegative)
The Separation Index provides enhanced sensitivity when evaluating complex activation markers or differentiating closely related cell subsets across heterogeneous primary samples.
4.6 Are these properties consistent between batches?
For commercial antibody production, consistency between manufacturing batches is a critical consideration.
A reliable internal QC system may evaluate:
- • Lot‑to‑lot staining consistency
- • Conjugation consistency
- • Reagent stability
- • Comparison with reference materials
- • Defined internal acceptance criteria
The specific QC framework varies between suppliers and applications. There is no single universal set of acceptance criteria that applies to every flow cytometry antibody.
What a Reliable Supplier Should Control Internally
Researchers usually see only the final validation image, but reliable antibody performance depends on quality control implemented throughout the entire development and manufacturing lifecycle, not just a single end‑point test.
A comprehensive supplier QC system may include evaluation of:
- • Antibody production quality: Clone‑specific expression validation, endotoxin level testing, and functional titer calibration to ensure consistent raw material performance across production runs.
- • Purity and stability: Monomeric purity verified via size‑exclusion chromatography (SEC), plus accelerated stability testing to confirm shelf‑life performance under recommended storage conditions.
- • Fluorochrome conjugation performance: Tight control of Degree of Labeling (DOL), final conjugate purity, and fluorescence activity to minimize batch‑to‑batch brightness variation.
- • Functional staining performance: Quantitative assessment of positive signal, background level, and population separation using standardized biological samples and instrument settings.
- • Batch consistency: Comparison of new production lots with qualified reference materials and predefined criteria for selected performance parameters.
- • Reference calibration: Alignment with widely accepted benchmark reagents or reference standards to ensure biological and technical consistency with broader research norms.
The purpose of QC is not simply to demonstrate that an antibody produces fluorescence, but to ensure that the reagent provides consistent and biologically meaningful performance across every manufactured lot.
What Should Researchers Look for in Supplier Validation Data?
When evaluating commercial flow cytometry antibodies, focus on the following four dimensions to assess reagent quality and application fit:
Biological relevance
- • Is the sample system appropriate for the intended application? Overexpression cell lines confirm target binding but may overestimate performance in physiological samples.
- • Is the target naturally expressed? Endogenous primary cell samples provide additional information on staining performance under biologically relevant conditions.
- • Does the staining pattern match known biological expectations? Anomalous distribution patterns may indicate non‑specific binding or off‑target reactivity.
Data quality
- • Is the positive population clearly separated from negative populations? Clear resolution is more critical than raw signal brightness.
- • Is background staining visible and interpretable? Datasheets that only show the positive peak without negative context provide incomplete performance information.
- • Are sufficient experimental details provided, including sample type, antibody concentration, and instrument settings?
Application compatibility
- • Is the fluorochrome suitable for the target expression level? Dim markers require bright fluorophores and high‑affinity clones to achieve usable resolution.
- • Is the fluorochrome compatible with your instrument’s laser and filter configuration?
- • Does the validation reflect the intended panel design? Single‑color validation is a baseline, but multi‑color panel compatibility requires additional assessment.
Consistency and transparency
- • Does the supplier provide clear, representative validation information rather than overly curated marketing imagery?
- • Are testing conditions and control types clearly described?
- • Is there evidence of systematic batch‑to‑batch quality evaluation, not just a single representative result?
A representative histogram is useful, but it should be interpreted as one part of a broader quality assessment.
Conclusion
Flow cytometry antibody quality is not defined by a single bright histogram or a high fluorescence value.
Reliable antibody performance depends on the combination of:
- • Appropriate biological validation
- • Controlled background staining
- • Clear population separation
- • Optimized fluorochrome conjugation
- • Reproducible manufacturing quality
Quantitative QC parameters such as MdFI, S/N, Stain Index, and Separation Index provide valuable tools for understanding antibody performance, but they must always be interpreted within the context of the biological system and experimental design.
For researchers, the most meaningful question is not simply:
“Is the signal bright?”
but rather:
“Does this antibody provide reliable, biologically relevant, and reproducible separation in my application?”
abinScience Flow Cytometry Antibodies
These principles guide the development and validation of AbinScience flow cytometry antibodies. AbinScience applies integrated quality evaluation throughout antibody production, fluorochrome conjugation, validation testing, and performance assessment to support reliable flow cytometry applications.
abinScience offers 4,200+ flow cytometry antibodies, available in FITC, PE, APC, and PerCP formats.
Browse FITC Antibodies | Browse PE Antibodies | Browse APC Antibodies | Browse PerCP Antibodies
Frequently Asked Questions
What is the most important QC parameter for a flow cytometry antibody?
No single parameter can fully define antibody quality. A reliable evaluation requires consideration of multiple factors, including biological staining pattern, signal intensity, background control, and population separation. For panel design and dim marker detection, resolution‑related parameters such as Stain Index can provide valuable information. However, these measurements should always be interpreted together with biological context.
Is a brighter antibody always better?
Not necessarily. The goal of flow cytometry staining is not maximum fluorescence intensity, but reliable discrimination between biological populations. An antibody with moderate signal and low background may perform better than a brighter antibody with poor resolution.
Should QC data from overexpression systems be considered reliable?
Overexpression data can confirm target recognition, but it may not accurately predict performance in physiological samples. For applications involving endogenous expression, validation using biologically relevant samples provides stronger evidence of real‑world performance.
Can MdFI values be directly compared between different instruments?
Generally, no. MdFI values are highly dependent on instrument configuration, including laser power, detector gain settings, and optical filter bandwidths, as well as staining protocol conditions. Direct cross‑instrument MdFI comparisons are not meaningful. Comparisons of antibody performance are most valid when run under standardized, identical instrument and experimental conditions.
What should researchers focus on when reviewing a supplier validation plot?
Researchers should evaluate the sample system and its biological relevance to their work, the level of background staining, the clarity of population separation, the suitability of the fluorochrome choice, and whether the validation conditions align with their intended experimental application. Focus on resolution and biological plausibility rather than raw signal brightness alone.
Related Reading
References
- [1] Clinical and Laboratory Standards Institute (CLSI). H62 — Validation of Assays Performed by Flow Cytometry. 1st ed. 2021.
- [2] Maecker HT, Trotter J. Flow cytometry controls, instrument setup, and the determination of positivity. Cytometry Part A. 2006;69A(9):1037–1042. doi:10.1002/cyto.a.20333
- [3] International Council for Standardization in Haematology (ICSH). Guidelines for the Use of Flow Cytometry in Clinical Laboratories. 2014.
- [4] Perfetto SP, Ambrozak D, Nguyen R, Chattopadhyay PK, Roederer M. Quality assurance for polychromatic flow cytometry using a suite of calibration beads. Nature Protocols. 2012;7(12):2067–2079. doi:10.1038/nprot.2012.126


 中文
中文 English
 한국어
한국어 日本語
日本語 Español
 Français
 Русский


