Flow cytometry data analysis requires both identifying cell populations and quantitatively describing fluorescence signal distributions. Determining whether to report positivity rate (percent positive) or fluorescence intensity for a given marker depends on the specific biological question and the underlying signal distribution of the target population.
For example, when evaluating an activation marker post-treatment, the percentage of positive cells may remain relatively stable while the entire positive population shifts toward higher fluorescence levels. In such cases, comparing percent positive alone fails to capture changes in expression magnitude, whereas reporting fluorescence intensity quantifies signal differences within the population.
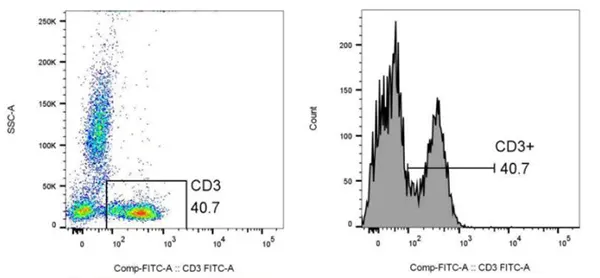
Figure 1. Representative modes of presenting flow cytometry results.
Percent positive and fluorescence intensity are distinct, non-interchangeable metrics. Percent positive quantifies the proportion of a target population relative to its parent population, whereas fluorescence intensity characterizes the signal distribution and shifts within that population. Proper data interpretation requires clarifying whether the research question concerns shifts in population frequency or single-cell signal intensity, and selecting statistical parameters accordingly.
Population Proportions vs. Signal Intensity in Flow Cytometry
Flow cytometry serves two primary functions: cell population gating and signal quantification.
When a marker is used to discriminate cell lineages—such as profiling CD4+ T cells, CD8+ T cells, B cells, or natural killer (NK) cells within peripheral blood mononuclear cells (PBMCs)—the primary metric of interest is the relative abundance of a population within its parent population. Here, percent positive directly reflects population composition.
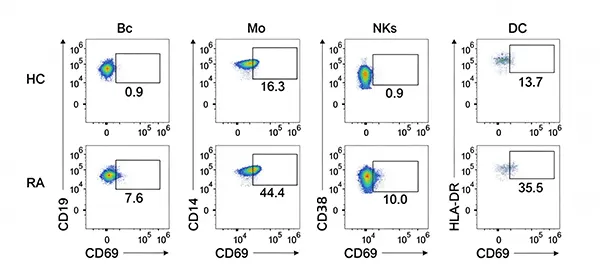
Figure 2. Shifts in cell positivity rates across treatment conditions (DOI: 10.3389/fimmu.2023.1096096).
For instance, if gating shows that CD4+ cells increase from 30% to 50% following treatment, the immediate conclusion is a shift in population proportion; evaluating single-cell signal intensity on a per-cell basis is unnecessary.
Conversely, when an experiment evaluates marker expression changes within a defined, pre-existing cell population—such as verifying whether an activation marker is upregulated post-stimulation—percent positive alone is often insufficient. Accurately assessing such responses requires analyzing the full fluorescence distribution and selecting an appropriate fluorescence intensity metric.
Percent positive and fluorescence intensity capture distinct dimensions of flow data: gating threshold cutoff yields event counts and percentages, whereas fluorescence intensity defines signal distribution characteristics within those gated events. Consequently, these two metrics can yield distinct yet complementary insights from the same dataset.
Assessing Cell Population Proportions via Percent Positivity
Calculating percent positivity relies on setting gating thresholds based on negative controls and population distributions to classify events as positive or negative. For lineage-defining markers such as CD4, CD8, CD19, and CD56, percent positivity serves as the primary readout when comparing subset composition.
A single marker can serve different analytical goals depending on the study context. For example, evaluating whether treatment alters the proportion of CD4+ T cells within total CD3+ T cells calls for reporting percent positivity. However, determining whether CD4 surface density on those T cells changes post-treatment requires assessing fluorescence intensity levels instead.
Thus, choice of statistical metric is context-dependent rather than marker-inherent. Percent positivity provides biological insight specifically when a marker functions as a population discriminator and the research objective is to measure shifts in cell lineage frequency.
Because percent positivity directly depends on gating strategies, negative controls, and threshold settings, reporting positivity rates requires explicitly stating the parent population. For instance, reporting percentages relative to "total singlets" versus "CD3+ cells" reflects distinct cellular relationships and cannot be interchanged.
Quantifying Intrapopulation Signal Changes via Fluorescence Intensity
When a marker is already expressed across a substantial majority of cells, relying solely on positivity rates can mask critical biological responses. Consider a scenario where baseline marker positivity is 80% and rises to only 82% post-treatment. Although the population frequency shifts by a modest 2 percentage points, the fluorescent signal of the positive population may have shifted substantially to higher intensities. Percent positivity merely records whether events exceed a binary gating threshold, ignoring signal magnitude beyond that boundary.
For example, kinetic analysis of CD69 expression on T cells stimulated with phorbol 12-myristate 13-acetate and ionomycin (PMA/ionomycin) demonstrates that while the percentage of CD69+ cells plateaus at high levels across timepoints, the geometric mean fluorescence intensity (gMFI) varies significantly between conditions. This confirms that once a population is predominantly positive, phenotypic changes manifest primarily as shifts in expression intensity rather than threshold crossing.
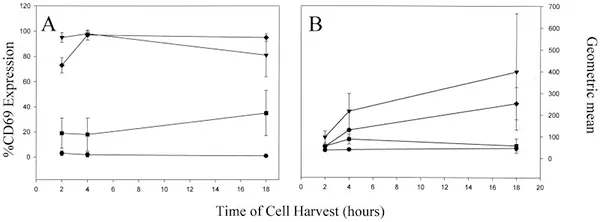
Figure 3. Changes in CD69+ cell percentage and mean fluorescence intensity following PMA/ionomycin stimulation (DOI: 10.1128/cdli.9.2.243-250.2001).
Consequently, a stable positivity rate does not imply an absence of biological change. Analysts should examine histograms or two-parameter density plots to assess whether the fluorescence distribution exhibits a rightward shift, changes in peak width, or the emergence of a distinct high-expression subpopulation. Quantitative fluorescence intensity comparison is warranted whenever distribution shifts occur.
Interpreting Concurrent Changes in Positivity Rate and Fluorescence Intensity
Experimental treatments frequently induce simultaneous increases in both percent positivity and signal intensity. In these cases, the two parameters report distinct, complementary dimensions of the cellular response.
For instance, if an activation marker increases from 30% to 60% positive post-stimulation while the median fluorescence intensity of the positive population increases significantly, reporting only the 60% positivity rate obscures the upregulation of antigen expression on individual responding cells. Conversely, reporting only fluorescence intensity fails to convey the expansion of the responding population. Similarly, evaluating CD69 and CD25 expression following T-cell receptor (TCR) stimulation at varying signal strengths reveals dose-dependent increases in both percent positive cells and geometric mean fluorescence intensity. Here, percent positivity reflects responder frequency, whereas intensity quantifies response magnitude per cell.
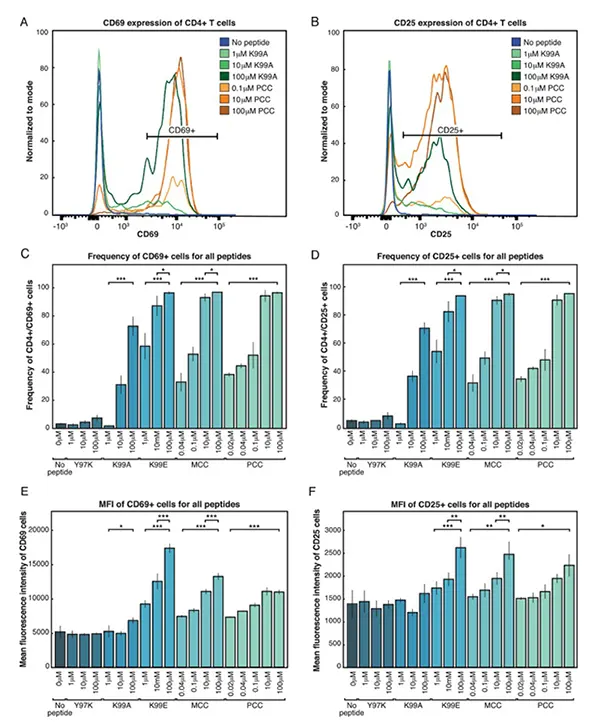
Figure 4. Percent positivity and geometric mean fluorescence intensity of CD69 and CD25 following TCR stimulation across varying intensities (DOI: 10.7554/eLife.10134).
When both metrics shift, researchers should avoid choosing one over the other arbitrarily. Dual reporting provides a comprehensive picture: percent positivity defines how many cells responded, while fluorescence intensity indicates the magnitude of the response within those cells.
Statistical Definitions and Calculation Methods for MFI
Once fluorescence intensity is selected for analysis, determining the specific statistical parameter is critical. Commonly reported intensity metrics in flow cytometry software include Median, Arithmetic Mean, Geometric Mean, and Mode. However, the abbreviation "MFI" is inconsistently defined across publication literature and analysis platforms.
| Metric |
Statistical Definition |
Key Characteristics |
Considerations & Caveats |
| Median |
50th percentile fluorescence value of ordered events |
Robust against extreme outliers |
Ideal for skewed distributions or populations with isolated high-intensity events |
| Arithmetic Mean |
Sum of fluorescence values divided by total events |
Sensitive to high and low extreme values |
Skewed tails or small high-fluorescence subsets disproportionately distort results |
| Geometric Mean |
n-th root of the product of fluorescence values (log-transformed average) |
Standard for log-normally distributed fluorescence data |
Software-specific data transformations and handling of zero/negative values must be verified |
| Mode |
Fluorescence value corresponding to distribution peak frequency |
Identifies the most frequent signal intensity |
Highly sensitive to binning width, peak shape, and bimodal distributions; strictly distinct from true MFI |
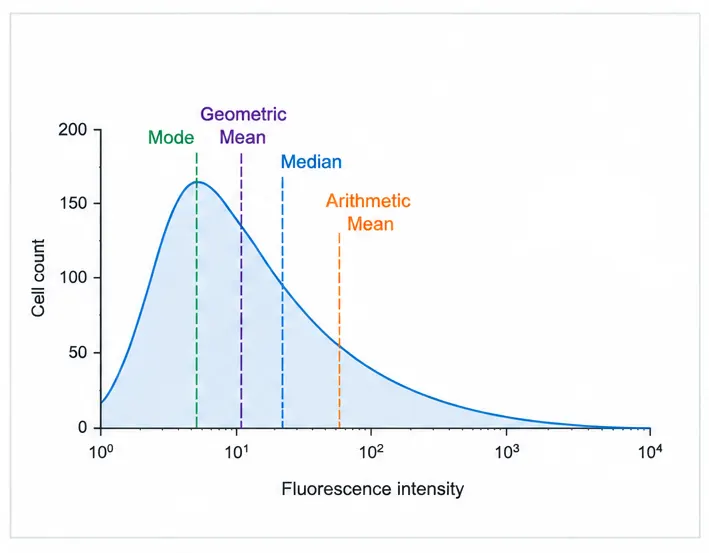
Figure 5. Overview of common fluorescence intensity metrics.
Because ambiguous phrasing (e.g., "MFI increased") fails to specify whether median, arithmetic mean, or geometric mean was calculated, scientific rigor demands explicit terminology. Authors should state the precise parameter used, such as Median Fluorescence Intensity (MFI / Median FI) or Geometric Mean Fluorescence Intensity (gMFI).
Furthermore, fluorescence signal in flow cytometry reflects relative instrument-detected intensity rather than absolute antigen density per cell. Antibody clone selection, fluorophore conjugation ratio, antibody concentration, staining conditions, cytometer voltage settings, and data transformation algorithms directly influence signal output. Consequently, fluorescence intensity measurements enable relative comparisons across treatment conditions within a controlled experimental platform. Absolute antigen quantification requires specialized calibration protocols (such as antibody-binding capacity beads) rather than raw uncalibrated MFI values.
Selecting the Right Metric Based on Experimental Goals and Data Distribution
Rather than assigning a fixed statistical metric (percent positive vs. MFI) to a marker based solely on its target name (e.g., CD4, CD69, PD-1), selection must depend on the experimental objective and observed signal distribution:
- ● Lineage gating & population shifts: Use percent positivity when the marker defines distinct subpopulations and the goal is to evaluate relative frequency changes.
- ● Intrapopulation expression shifts: Evaluate fluorescence intensity (Median FI or gMFI) when assessing activation state or expression level variations within a gated population.
- ● Simultaneous expansion and upregulation: Report both percent positivity and fluorescence intensity when treatment alters both population abundance and single-cell signal density.
- ● Bimodal or multimodal distributions: Determine whether distinct peaks represent biologically separate subsets (requiring additional gating sub-classification) prior to computing population-level summary statistics.
Markers such as CD4, CD8, CD69, CD25, or Programmed Cell Death Protein 1 (PD-1) do not have inherently fixed analysis metrics. The optimal readout depends on the marker's functional role in the gating hierarchy, the distribution geometry, and the underlying biological question.
Flow cytometry statistics are mathematical abstractions of multidimensional cell populations and signal distributions. Metrics such as percent positivity, median fluorescence intensity, geometric mean, or arithmetic mean summarize specific aspects of raw data and cannot be interpreted in isolation from gating plots and experimental context.
A rigorous analysis workflow begins with the raw distribution: identifying target populations, characterizing signal geometry, and establishing whether observed treatment effects stem from population frequency shifts, per-cell expression changes, or structural heterogeneity. Aligning the statistical parameter with the underlying data distribution ensures that flow cytometry outputs yield meaningful, accurate biological insights.
References
- [1] Cossarizza, A., Chang, H. D., Radbruch, A., Abrignani, S., Addo, R., Akdis, M., Andrä, I., Andreata, F., Annunziato, F., Arranz, E., Bacher, P., Bari, S., Barnaba, V., Barros-Martins, J., Baumjohann, D., Beccaria, C. G., Bernardo, D., Boardman, D. A., Borger, J., Böttcher, C., … Yang, J. (2021). Guidelines for the use of flow cytometry and cell sorting in immunological studies (third edition). European Journal of Immunology, 51(12), 2708–3145. https://doi.org/10.1002/eji.202170126
- [2] Preglej, T., Brinkmann, M., Steiner, G., Aletaha, D., Göschl, L., & Bonelli, M. (2023). Advanced immunophenotyping: A powerful tool for immune profiling, drug screening, and a personalized treatment approach. Frontiers in Immunology, 14, 1096096. https://doi.org/10.3389/fimmu.2023.1096096
- [3] O'Neil-Andersen, N. J., & Lawrence, D. A. (2002). Differential modulation of surface and intracellular protein expression by T cells after stimulation in the presence of monensin or brefeldin A. Clinical and Diagnostic Laboratory Immunology, 9(2), 243–250. https://doi.org/10.1128/cdli.9.2.243-250.2001
- [4] Allison, K. A., Sajti, E., Collier, J. G., Gosselin, D., Troutman, T. D., Stone, E. L., Hedrick, S. M., & Glass, C. K. (2016). Affinity and dose of TCR engagement yield proportional enhancer and gene activity in CD4+ T cells. eLife, 5, e10134. https://doi.org/10.7554/eLife.10134
- [5] Coder, D. M., Redelman, D., & Vogt, R. F. (1994). Computing the central location of immunofluorescence distributions: logarithmic data transformations are not always appropriate. Cytometry, 18(2), 75–78. https://doi.org/10.1002/cyto.990180204
Looking for Reliable Flow Cytometry Antibodies to Support your Experimental Workflows?
abinScience Flow Cytometry Antibodies are subjected to rigorous quality control to ensure consistent fluorescent performance and clear discrimination of cell populations, supporting robust and reproducible flow cytometry analyses.
Learn More about abinScience Flow Cytometry Antibodies
About Us
abinScience was founded in 2023 as a strategic venture of AtaGenix (established 2011), dedicated to delivering premium life science reagents that accelerate discovery.
abinScience flow cytometry antibody products cover commonly used detection markers, with a wide variety to meet the research needs of multiple species(Human, Mouse, Rat, Dog, Hamster, Monkey, etc.)We provide stable and reliable support for scientific research.



 中文
中文 English
 한국어
한국어 日本語
日本語 Español
 Français
 Русский


