In flow cytometry, observing divergent positivity rates for the same biomarker across experimental conditions is a common occurrence. Cellular activation, ligand engagement, or metabolic shifts frequently induce dynamic changes in target antigen availability, leading to distinct positivity profiles before and after treatment, across time courses, or between staining protocols.
Consider three typical scenarios:
- • Baseline vs. Post‑treatment: Surface positivity of a membrane protein drops from 70% to 20% following stimulation.
- • Time‑course Kinetics: Serial measurements at 0 h, 2 h, 6 h, and 24 h yield positivity rates of 20%, 70%, 45%, and 15%, respectively.
- • Surface vs. Intracellular Staining: Surface staining detects 20% positivity in a sample, whereas intracellular staining following fixation and permeabilization reveals 70% positivity.
These seemingly conflicting results are rarely experimental artifacts. Instead, they capture the target marker across distinct biological states, temporal phases, and subcellular locations. Rather than asking "which positivity rate is correct," researchers should address a fundamental question: Which biological state of the marker does a given positivity rate reflect?
Impact of Cellular Activation and Antigen Dynamics on Positivity Rates
Flow cytometric positivity indicates antigen detectability, not simply the presence or absence of a protein within the cell. For dynamically regulated proteins, total protein abundance and antigen accessibility to fluorophore‑conjugated antibodies are distinct parameters.
Plasma membrane protein density is governed by a dynamic equilibrium involving protein synthesis, intracellular trafficking, endocytosis, recycling, and degradation. EGFR serves as a classic model: upon ligand binding, EGFR internalizes into endosomal compartments and is subsequently directed toward recycling pathways or lysosomal degradation. Consequently, total cellular EGFR expression does not guarantee consistent surface antigen detection at any given time point.
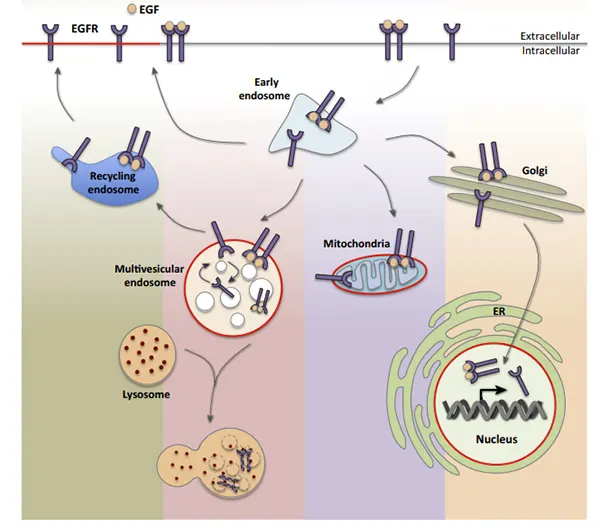
Figure 1. EGF‑induced EGFR receptor trafficking (DOI: 10.1016/j.tcb.2015.12.006)
When a treatment reduces surface positivity from 70% to 20%, two distinct biological phenomena may be at play:
- • Population‑level shift: The proportion of cells expressing the marker has decreased.
- • Molecular‑level shift: Target antigen state or accessibility within the cell population has altered, rendering the protein temporarily undetectable by surface staining.
Both scenarios yield a decreased positivity rate on a flow cytometer, yet they represent fundamentally different biological mechanisms. Evaluating a shift in positivity requires determining whether the change reflects population dynamics or changes in marker synthesis, localization, or epitope availability.
Differentiating Surface Signal Decline from Protein Downregulation
Surface staining specifically detects target antigens localized to the plasma membrane and accessible to antibody binding. A post‑treatment reduction in surface fluorescence intensity does not necessarily indicate target protein degradation.
Receptor Endocytosis
Ligand engagement frequently triggers rapid internalization. For instance, CXCR4 internalizes rapidly upon binding to CXCL12. Internalized receptors are either recycled back to the cell surface or routed to degradative pathways. A decrease in surface signal under these conditions reflects normal receptor trafficking rather than absolute protein loss.
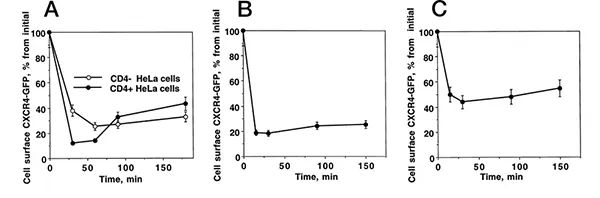
Figure 2. SDF‑1α‑induced CXCR4 endocytosis and recycling (DOI: 10.1074/jbc.273.26.15883).
Ectodomain Shedding
Antigen stimulation of T cells triggers rapid cleavage and surface clearance of L‑selectin (CD62L) within minutes, releasing soluble CD62L into the extracellular environment. Similarly, extracellular adenosine triphosphate (ATP) induces rapid shedding of surface CD27 on lymphocytes. In both cases, decreased surface positivity results from proteolytic cleavage and release of the extracellular domain rather than intracellular clearance.
Epitope Masking and Accessibility
Antibody binding depends on epitope accessibility, which can be altered by conformational changes, steric hindrance, or complex formation with secondary proteins. Following PMA stimulation, distinct anti‑CD4 antibody clones exhibit varying resolution of CD4+ T cell populations due to differential epitope sensitivity.
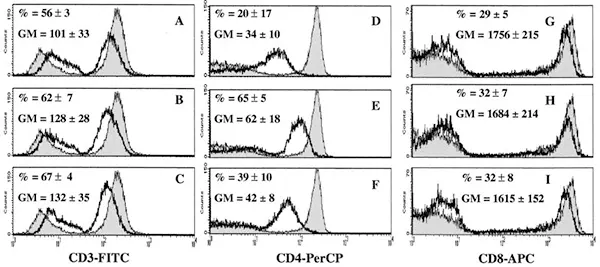
Figure 3. Surface staining of whole blood T cells stimulated with PMA/ionomycin (PMA‑ION), brefeldin A (BFA), or monensin (MN) using CD3‑FITC, CD4‑PerCP, and CD8‑APC (DOI: 10.1128/cdli.9.2.243‑250.2001).
A drop in surface staining should be described precisely as a reduction in membrane‑accessible antigen rather than loss of protein expression. The biological pathway follows a clear hierarchy:
Cellular State Alteration→ Altered Trafficking / Shedding / Masking → Reduced Surface Availability → Decreased Surface Positivity
Delineating whether a surface signal reduction stems from endocytosis, shedding, or transcriptional downregulation requires complementary validation, such as intracellular staining, soluble protein quantification (ELISA), or fluorescence microscopy.
Temporal Kinetics of Marker Expression
While membrane trafficking explains spatial variation, expression kinetics account for time‑dependent discrepancies across time points.
During human peripheral blood T cell activation, surface markers follow distinct temporal trajectories. Upon activation with PHA, the early activation marker CD69 increases rapidly, whereas CD25 and CD71 upregulation peaks significantly later. Concurrently, surface CD62L levels decline as activation progresses.
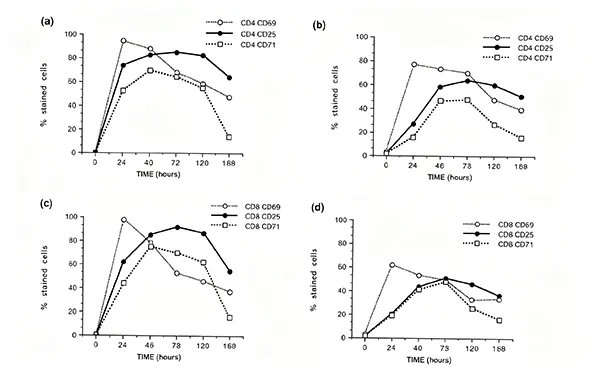
Figure 4. Time course of CD69, CD25, and CD71 expression following PHA stimulation (DOI: 10.1111/j.1365‑3083.1992.tb02879.x).
Observing positivity rates of 20% (0 h) → 70% (2 h) → 45% (6 h) → 15% (24 h) represents a single, continuous dynamic curve covering induction, peak expression, clearance, and re‑equilibration. "Post‑treatment" is not a static state; sampling at different time windows captures distinct operational phases of cellular response.
When evaluating treatments involving PMA, anti‑CD3/CD28, cytokines, or other experimental treatments, the stimulus itself alters cellular state, which subsequently drives target antigen expression and spatial distribution over time.
Comparative Mechanics of Surface vs. Intracellular Staining
Discrepancies between surface staining and intracellular staining do not imply protocol failure. Surface staining quantifies target antigens on the intact plasma membrane, whereas intracellular staining measures total or organelle‑sequestered protein pools following cell fixation and permeabilization (Fix/Perm).
When membrane proteins undergo endocytosis or accumulate intracellularly, surface signals decrease while intracellular signals remain elevated.
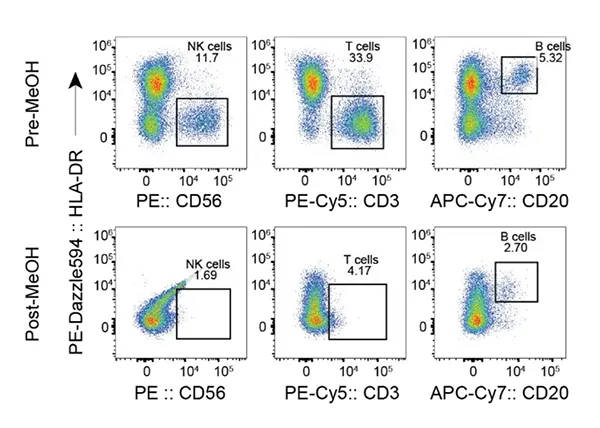
Figure 5. Impact of fixation on marker positivity (DOI: 10.1002/cyto.a.24904).
Impact of Staining Sequence and Buffers
Experimental workflows typically perform surface staining prior to Fix/Perm reagents. However, certain fixatives and detergents can alter epitope integrity or quench fluorophores attached to surface‑bound antibodies. Conversely, performing fixation prior to surface staining can mask extracellular epitopes. Protocols must be optimized and validated based on specific marker epitopes, fluorophore stability, and buffer compositions.
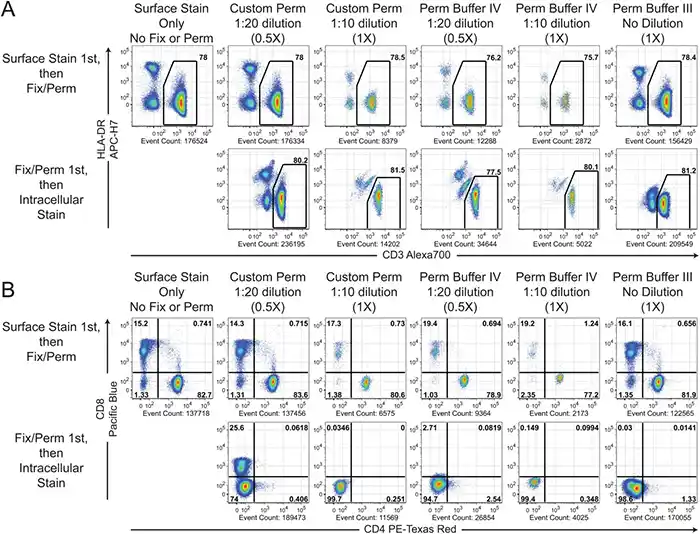
Figure 6. Influence of staining sequence on flow cytometric resolution (DOI: 10.1002/cyto.a.22444).
Evaluating combined surface and intracellular staining patterns provides functional insights into antigen localization:
| Surface Signal |
Intracellular Signal |
Biological Interpretation |
| ↑ |
↑ |
Overall upregulation of protein expression/synthesis. |
| ↓ |
≈ |
Surface‑restricted loss (e.g., ectodomain shedding or selective surface cleavage). |
| ↓ |
↑ |
Receptor endocytosis, organelle sequestration, or intracellular accumulation. |
| ↓ |
↓ |
Global protein downregulation, degradation, or translational inhibition. |
| ↑ |
↓ |
Translocation of intracellular protein pools to the plasma membrane. |
Conclusively identifying molecular mechanisms requires orthogonal validation: pairing surface and intracellular staining across detailed time courses, measuring soluble antigen shedding, tracking spatial localization via high‑resolution imaging, or analyzing total protein abundance via western blotting.
Strategic Framework for Flow Cytometry Data Interpretation
Discrepancies in flow cytometry positivity rates across experimental conditions, time courses, and staining protocols should be evaluated systematically across three core dimensions:
- 1. Temporal Dimension: Identifying the kinetic stage of marker induction, peak, or clearance.
- 2. Spatial Dimension: Distinguishing plasma membrane localization from intracellular compartments.
- 3. Population Dimension: Differentiating true changes in positive cell frequency from shifts in per‑cell antigen density or accessibility.
Flow cytometric positivity is a context‑dependent measurement of antigen detectability at a specific moment, cellular state, and subcellular location. Biomarkers are dynamic cellular components that shift in response to functional cues. When analyzing divergent data, evaluating these three dimensions transforms apparent anomalies into meaningful biological insights.
References
- [1] Tan, X., Lambert, P. F., Rapraeger, A. C., & Anderson, R. A. (2016). Stress‑Induced EGFR Trafficking: Mechanisms, Functions, and Therapeutic Implications. Trends in cell biology, 26(5), 352–366. https://doi.org/10.1016/j.tcb.2015.12.006
- [2] Yang, S., Liu, F., Wang, Q. J., Rosenberg, S. A., & Morgan, R. A. (2011). The shedding of CD62L (L‑selectin) regulates the acquisition of lytic activity in human tumor reactive T lymphocytes. PloS one, 6(7), e22560. https://doi.org/10.1371/journal.pone.0022560
- [3] Tarasova, N. I., Stauber, R. H., & Michejda, C. J. (1998). Spontaneous and ligand‑induced trafficking of CXC‑chemokine receptor 4. The Journal of biological chemistry, 273(26), 15883–15886. https://doi.org/10.1074/jbc.273.26.15883
- [4] O'Neil‑Andersen, N. J., & Lawrence, D. A. (2002). Differential modulation of surface and intracellular protein expression by T cells after stimulation in the presence of monensin or brefeldin A. Clinical and diagnostic laboratory immunology, 9(2), 243–250. https://doi.org/10.1128/cdli.9.2.243‑250.2001
- [5] Biselli, R., Matricardi, P. M., D'Amelio, R., & Fattorossi, A. (1992). Multiparametric flow cytometric analysis of the kinetics of surface molecule expression after polyclonal activation of human peripheral blood T lymphocytes. Scandinavian journal of immunology, 35(4), 439–447. https://doi.org/10.1111/j.1365‑3083.1992.tb02879.x
- [6] Fahlberg, M. D., Forward, S., Assita, E. R., Mazzola, M., Kiem, A., Handley, M., Yun, S. H., & Kwok, S. J. J. (2024). Overcoming fixation and permeabilization challenges in flow cytometry by optical barcoding and multi‑pass acquisition. Cytometry. Part A : the journal of the International Society for Analytical Cytology, 105(11), 838–848. https://doi.org/10.1002/cyto.a.24904
- [7] Crawford, T. Q., Jalbert, E., Ndhlovu, L. C., & Barbour, J. D. (2014). Concomitant evaluation of PMA+ionomycin‑induced kinase phosphorylation and cytokine production in T cell subsets by flow cytometry. Cytometry. Part A : the journal of the International Society for Analytical Cytology, 85(3), 268–276. https://doi.org/10.1002/cyto.a.22444
Looking for Reliable Flow Cytometry Antibodies to Support your Experimental Workflows?
abinScience Flow Cytometry Antibodies are subjected to rigorous quality control to ensure consistent fluorescent performance and clear discrimination of cell populations, supporting robust and reproducible flow cytometry analyses.
Learn More about abinScience Flow Cytometry Antibodies
About Us
abinScience was founded in 2023 as a strategic venture of AtaGenix (established 2011), dedicated to delivering premium life science reagents that accelerate discovery.
abinScience flow cytometry antibody products cover commonly used detection markers, with a wide variety to meet the research needs of multiple species(Human, Mouse, Rat, Dog, Hamster, Monkey, etc.)We provide stable and reliable support for scientific research.



 中文
中文 English
 한국어
한국어 日本語
日本語 Español
 Français
 Русский


